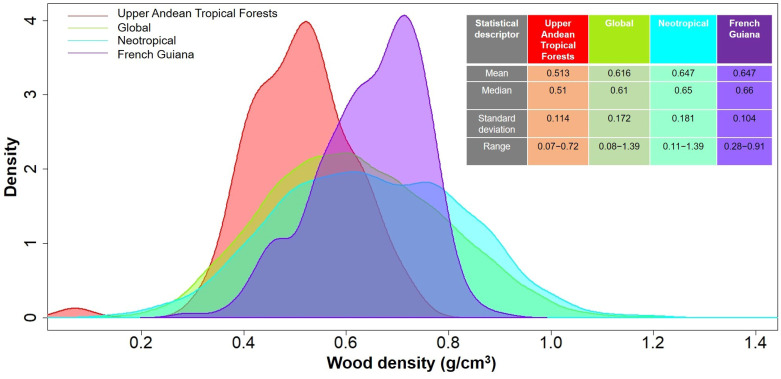
Figure 3.
Density plots comparing wood density in upper Andean tropical forests, a lowland tropical rainforest in French Guiana (Baraloto et al., 2010), the Neotropics (Chave et al., 2006), and a global database (Zanne et al., 2009). Mean, median, standard deviation and range are shown on the upper right side.

