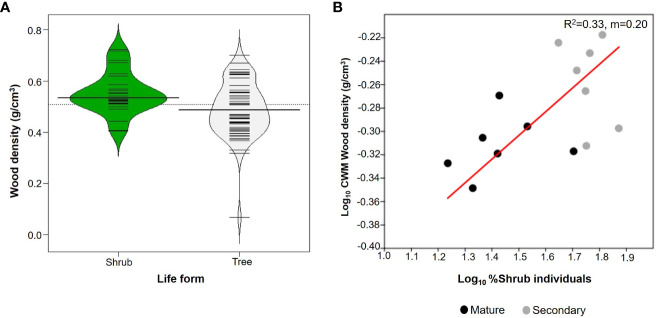
Figure 4.
(A) Beanplots comparing shrubs (27 species) and trees (59 species) from upper Andean tropical forests plots. Each horizontal line represents the mean value of a species. (B) Reduced major axis regression between the % of individuals that are shrubs in each individual plot and community weighted mean (CWM) of wood density per plot. Values on the right corner of the plot are the coefficient of determination (R2) and slope (m). Grey circles correspond to secondary forests and black circles to mature forests plots.

