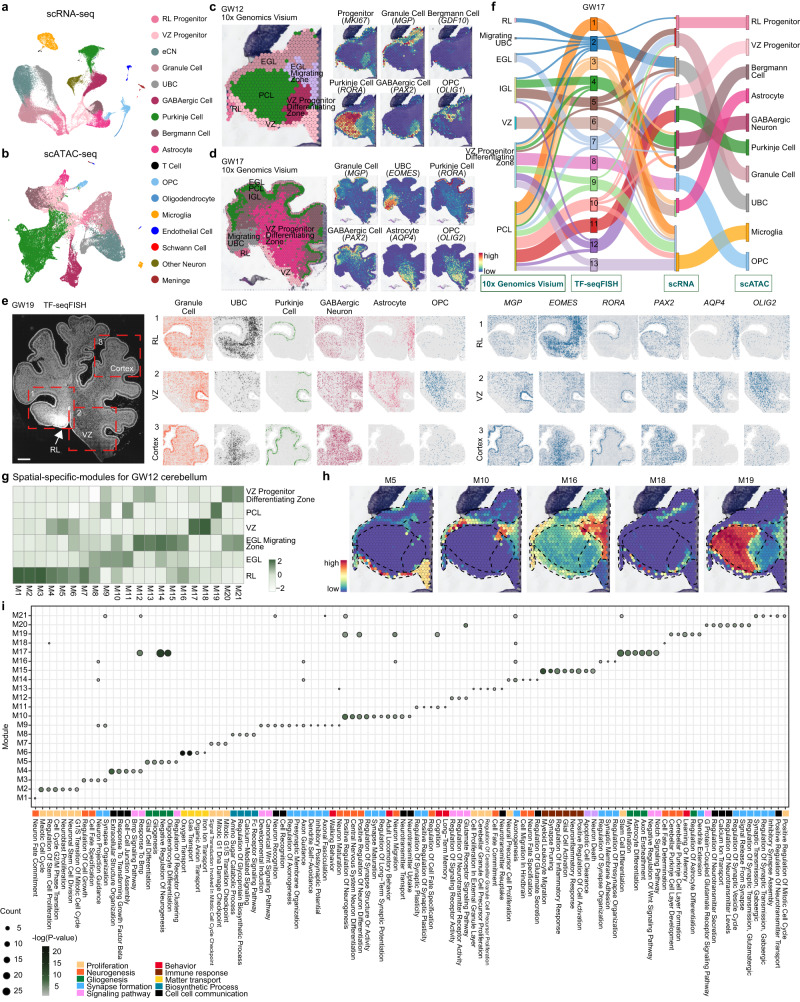
Fig. 1. Temporal-spatial molecular diversity of single cells from the developing human cerebellum.
a, b Visualization of seventeen major classes of RNA-seq data (a) and thirteen classes of ATAC-seq data (b) in the developing human cerebellum using UMAP. Each dot represents a single cell, and cells are laid out to show similarities. Each cell color represents the cell type (RL, rhombic lip; VZ, ventricular zone; eCN, excitatory cerebellar nuclei cell; UBC, unipolar brush cell; OPC, oligodendrocyte precursor cell). c, d 10x Genomics Visium data showing the spatial distribution of different clusters in the GW12 (c) and GW17 (d) cerebellum. The expression of known markers is shown using the same layout on the right. e Images of DAPI staining showing the regions of TF-seqFISH in the GW19 cerebellum. TF-seqFISH plots showing the spatial distribution of different cell types in the GW19 cerebellum. Panels 1, 2, and 3 show the RL, VZ and cerebellar cortex, respectively. TF-seqFISH plots showing the gene patterns in the GW19 cerebellum using the same layout on the right. Scale bar, GW19, 500 μm. f Sankey plot showing the correlation between scRNA-seq, scATAC-seq, TF-seqFISH and 10x Genomics Visium Data in GW17. g Heatmap showing the spatial-specific modules for the GW12 cerebellum. h Gene patterns of each module shown in the same layout in (c). i Gene Ontology analysis of spatial-specific modules showing the KEGG pathways or biological processes in the GW12 cerebellum. Dots show the numbers of genes in each module, and the scale bar shows the -log(P-value) for the GO terms. Hypergeometric test.

