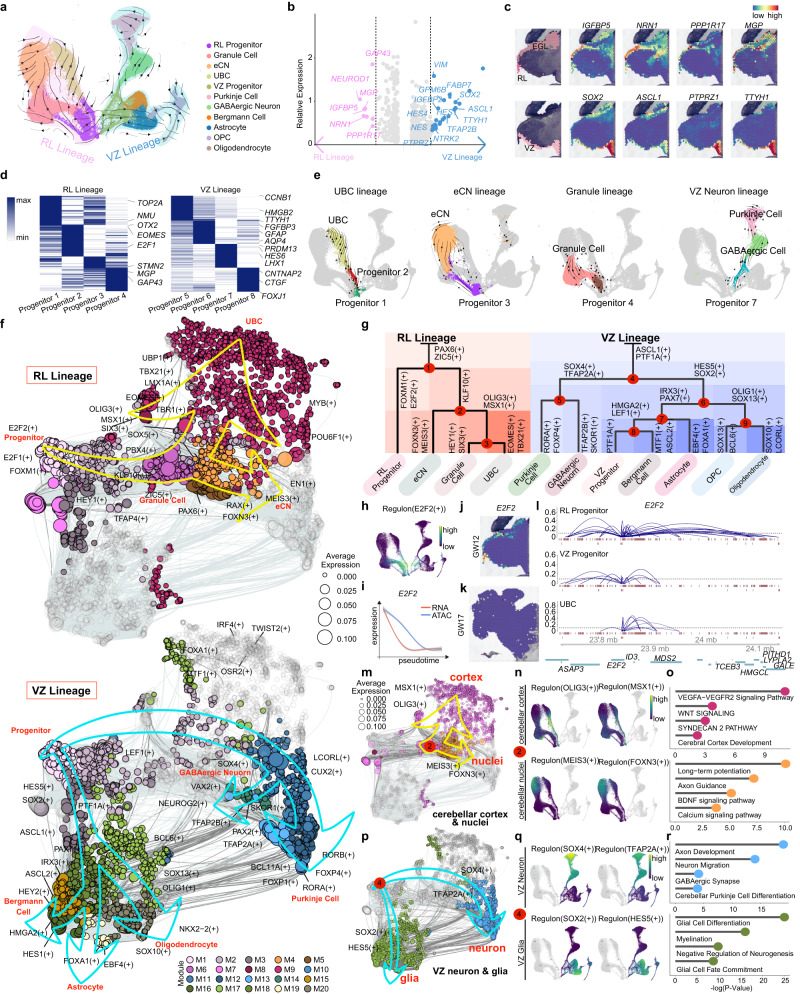
Fig. 2. Cell diversity and regulon-typed cell-type specificity in the developing human cerebellum.
a Velocity visualization of the RL lineage and VZ lineage in the developing human cerebellum. b Scatterplot of all genes for correlation with the conserved differentiation network across the RL lineage (red plot) and VZ lineage (blue plot). c 10x Genomics Visium data showing the spatial distribution of RL and VZ in the GW12 cerebellum. The expression of region markers is shown using the same layout on the right. d Heatmap showing the expression level and identity of genes in RL progenitors and VZ progenitors. Specific gene expression in each type is shown on the right of the heatmap panel. e Velocity visualization of the UBC, eCN, granule cell and VZ neuron lineages using the same layout as in Fig. 2a. Cells from other lineages are colored gray. f Regulon-target modules showing the lineage trajectory in the developing cerebellum from progenitors to different cell types. RL lineage (top), VZ lineage (bottom). g A dendrogram of regulons on the top for each cell cluster in the main lineage in the cerebellum except for microglia, meninges, T cells, Schwann cells, endothelial cells and other neurons, showing the lineage trajectory in the developing cerebellum. The TFs shown at each branching of the dendrogram are representative of subjacent groups of regulons. h Regulon E2F2 patterns shown in the UMAP plots using the same layout as in Fig. 2a, black, no expression; yellow, relative expression. i Gene expression of RNA (red) and ATAC (blue) across pseudotime for E2F2. The shadow represents the 95% confidence interval around the fitted curve. j, k 10x Genomics Visium data showing the gene E2F2 spatial expression in the GW12 (j) and GW17 cerebellum (k). l Cicero coaccessibility in the region surrounding the E2F2 gene is shown for different cell types. m Regulon-target modules showing the differentiation point between the cerebellar cortex and nuclei in the RL lineage. n Feature Plots of Regulon MEIS3, FOXN3, OLIG3 and MSX1 in the RL lineage. o GO terms of the targets of the cortex or nuclei modules. Hypergeometric test. p Regulon-target modules showing the differentiation point between neurons and glia in the VZ lineage. q Feature Plots of Regulon SOX4, TFAP2A, SOX2 and HES5 in the VZ lineage. r GO terms of the targets of the VZ neuron or glial modules. Hypergeometric test.

