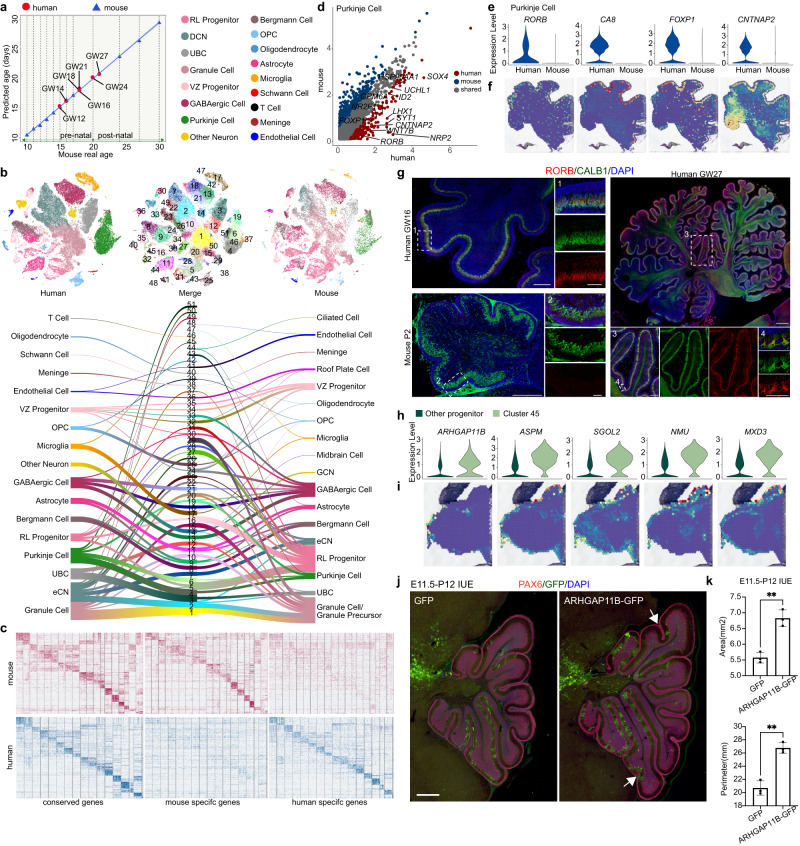
Fig. 5. Specific genes expressed in the developing human cerebellum.
a The chart shows the predicted mouse age of the developing human cerebellum. The blue triangle shows the real age and predicted age of the developing mouse cerebellum. The red dot shows the predicted mouse age of human data (GW12: E15, GW14: E16, GW16-20: E18, GW24: P0, GW27: P2). b tSNE visualization of human (GW12-27) and mouse (E15-P4) neural lineage cell types analyzed using CCA and color-coded based on CCA joint clusters (top middle) and cell type. The top left graph shows human cell types, and the top right graph shows mouse cell types, with each dot representing a single cell. River plots comparing cell type assignments for humans and mice with CCA joint clusters. c Heatmap showing the conserved genes, mouse-specific genes and human-specific genes between the human (GW12-27) and mouse cerebellum (E15-P4). d Pairwise comparison of gene expression in Purkinje cells between humans and mice. The red dots (human) and blue dots (mouse) indicate differentially expressed genes across species. e Vlnplots of RORB, CA8, FOXP1 and CNTNAP2 expression in Purkinje cells between humans and mice. f 10x Genomics Visium data showing RORB, CA8, FOXP1 and CNTNAP2 expression in the GW17 cerebellum. g Immunofluorescence images of RORB and CALB1 in human GW16 and mouse P0. Scale bar, 300 μm (left) and 100 μm (right) for human GW16; 300 μm (left) and 100 μm (right) for mouse P2. The experiments were repeated three times independently with similar results. h Vln plots of ARHGAP11B, ASPM, SGOL2, NMU and MXD3 expression in progenitors in the human cerebellum. i 10x Genomics Visium data showing ARHGAP11B, ASPM, SGOL2, NMU and MXD3 expression in the GW12 cerebellum. j Overexpression of ARHGAP11B at E11.5 promotes cerebellar cortex folding observed at P2 in mice. Scale bars, 500 μm. k Quantification of the area and perimeter of the mouse cerebellar cortex at P12. **P < 0.01, P value(area)=0.0024, P value(perimeter)=0.0015, two-sided t-test, n = 3 biologically independent animals. mean ± s.e.m.

