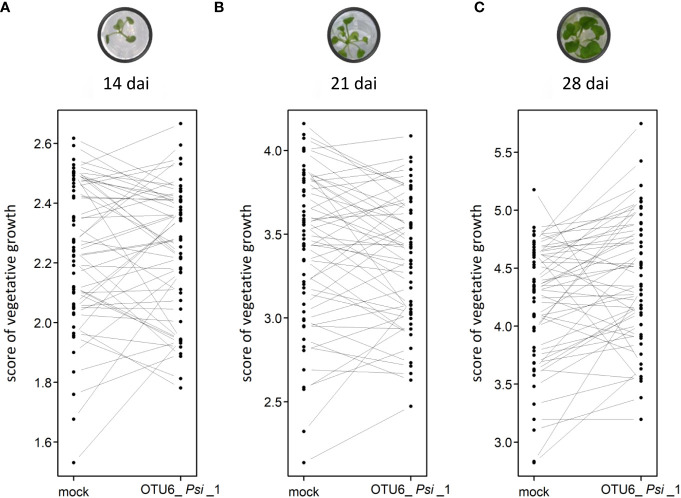
Figure 2.
Interaction plots illustrating the genetic variation of response to the OTU6_Psi_1 strain at the population level at 14 dai (A), 21 dai (B) and 28 dai (C). Each dot corresponds to the genotypic value of one of the 54 populations of A thaliana. Each line corresponds to the response of one of the 54 populations to the inoculation with the OTU6_Psi_1 strain.

