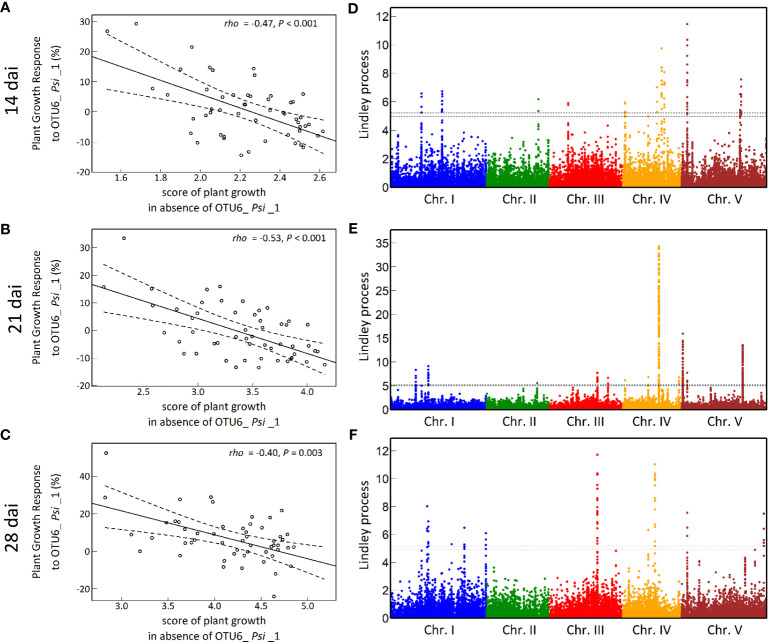
Figure 3.
The genetic architecture of plant growth response (PGR) to the OTU6_Psi_1 strain. (A-C) Negative trade-offs at the population level between the level of PGR to OTU6_Psi_1 (expressed in percentage relative to the mock treatment) and the score of plant growth in absence of OTU6_Psi_1, at 14 dai, 21 dai and 28 dai. Each dot corresponds to the genotypic value of one of the 54 natural populations of A. thaliana. rho: correlation coefficient of Spearman between the response to OTU6_Psi_1 and the score of plant growth in absence of OTU6_Psi_1. P: p-value. The solid line corresponds to the fitted regression line, whereas the dashed lines delimit the band of 99% confidence intervals. (D-F) Manhattan plots of the Lindley process for PGR to OTU6_Psi_1 at 14 dai, 21 dai and 28 dai. The x-axis corresponds to the physical position of 1,638,649 SNPs on the five chromosomes. The dashed line indicates the chromosome-wide significance threshold.

