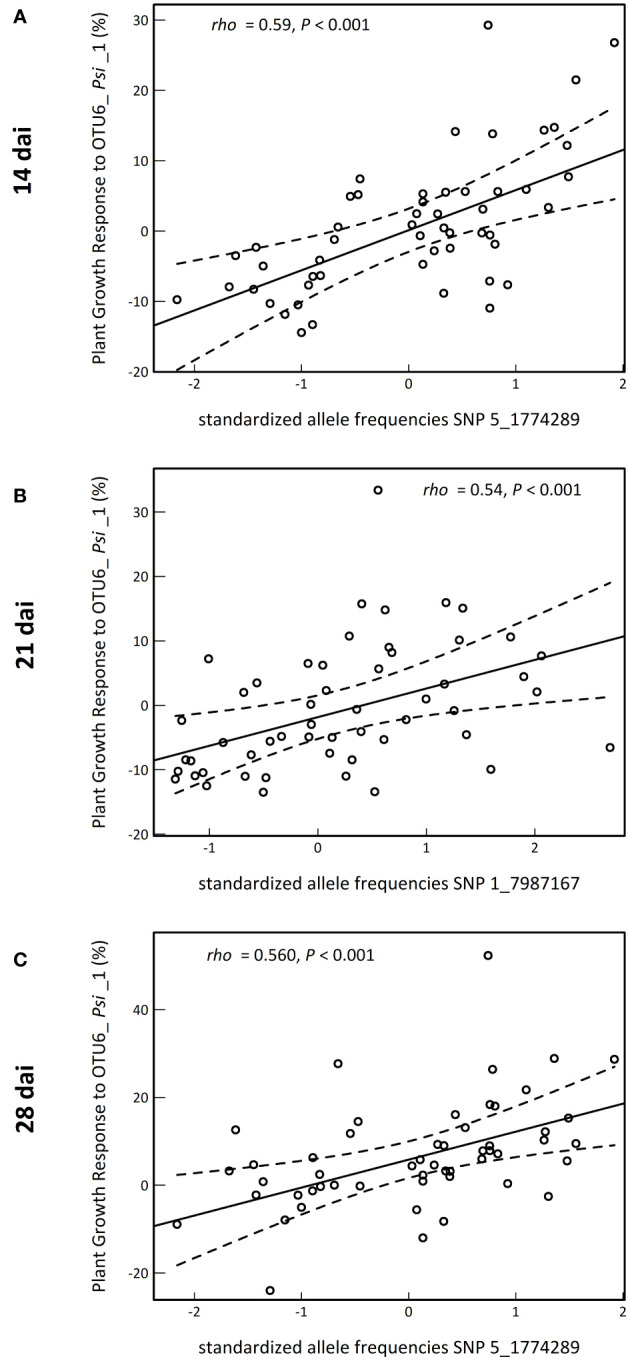
Figure 4.

Illustration of the relationship between the level of plant growth response to the OTU6_Psi_1 strain (expressed in percent to the mock treatment) and the standardized allele frequencies of a top SNP presenting both one of the highest genotype-phenotype relationships and a signature of local adaptation at 14 dai (A), 21 dai (B) and 28 dai (C). rho: correlation coefficient of Spearman. P: p-value. The solid line corresponds to the fitted regression line, whereas the dashed lines delimit the band of 99% confidence intervals.
