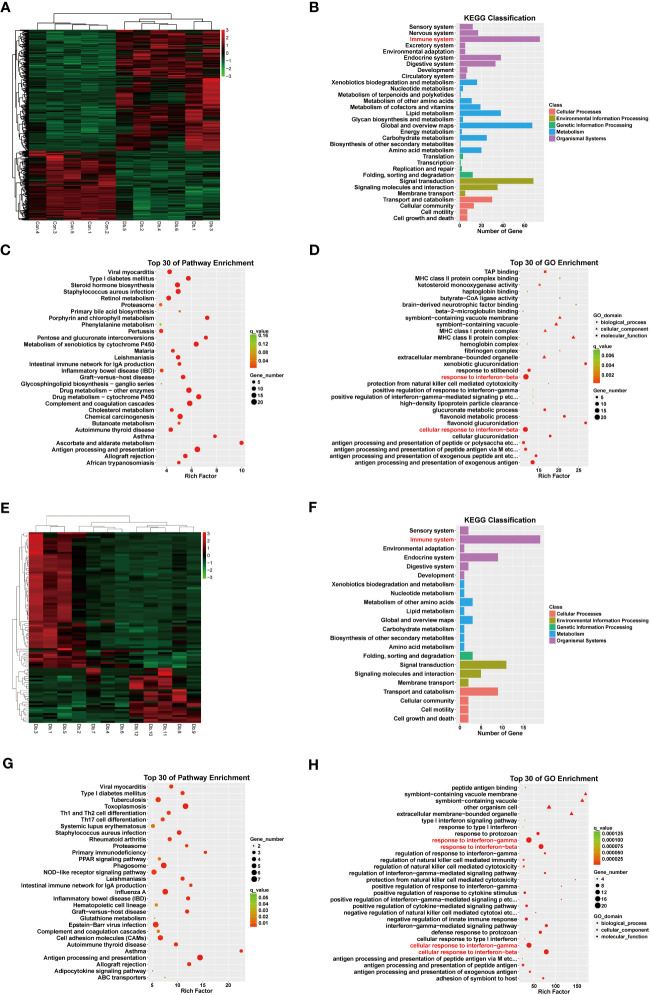
Figure 2.
RNA sequencing revealed differentially expressed genes and pathways in diabetic kidney disease and dapagliflozin treatment. (A) Heatmap indicating distinct gene expression patterns of normal (Con1-5) versus diabetic (Db1-6) mouse kidneys. (B) KEGG classification analysis suggested that DEGs between normal and diabetic mouse kidneys were enriched in the immune system (red). (C) KEGG enrichment analysis indicating the top 30 pathways enriched in DEGs between normal and diabetic mouse kidneys. (D) GO enrichment analysis indicating the top 30 pathways enriched in DEGs between normal and diabetic mouse kidneys, highlighting interferon-related pathways (red). (E) Heatmap indicating distinct gene expression patterns of diabetic (Db1-6) versus dapagliflozin-treated diabetic (Db7-12) mouse kidneys. (F) KEGG classification analysis suggesting DEGs between diabetic and dapagliflozin-treated diabetic mouse kidneys were enriched in the immune system (red). (G) KEGG enrichment analysis indicating the top 30 pathways enriched in DEGs between diabetic and dapagliflozin-treated diabetic mouse kidneys. (H) GO enrichment analysis indicating the top 30 pathways enriched in DEGs between diabetic and dapagliflozin-treated diabetic mouse kidneys, highlighting interferon-related pathways (red).

