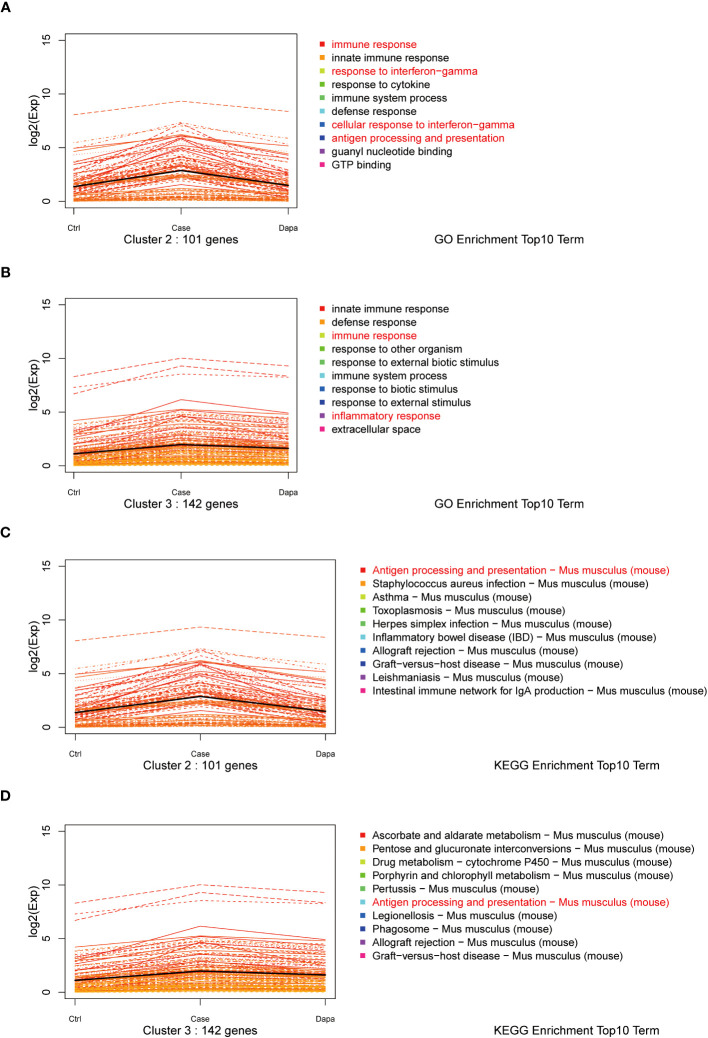
Figure 3.
K-means analysis of RNA sequencing results. K-means analysis yielded 10 clusters with different expression patterns among the Ctrl, Case, and Dapa groups. Cluster 2 and 3 showed apparently different expression patterns among Ctrl, Case, and Dapa groups. (A) Expression patterns of genes in Cluster 2 with the top 10 enriched pathways listed according to GO terms. (B) Expression patterns of genes in Cluster 3 with the top 10 enriched pathways listed according to GO terms. (C) Expression patterns of genes in Cluster 2 with the top 10 enriched pathways listed according to the KEGG database. (D) Expression patterns of genes in Cluster 3 with the top 10 enriched pathways listed according to the KEGG database.

