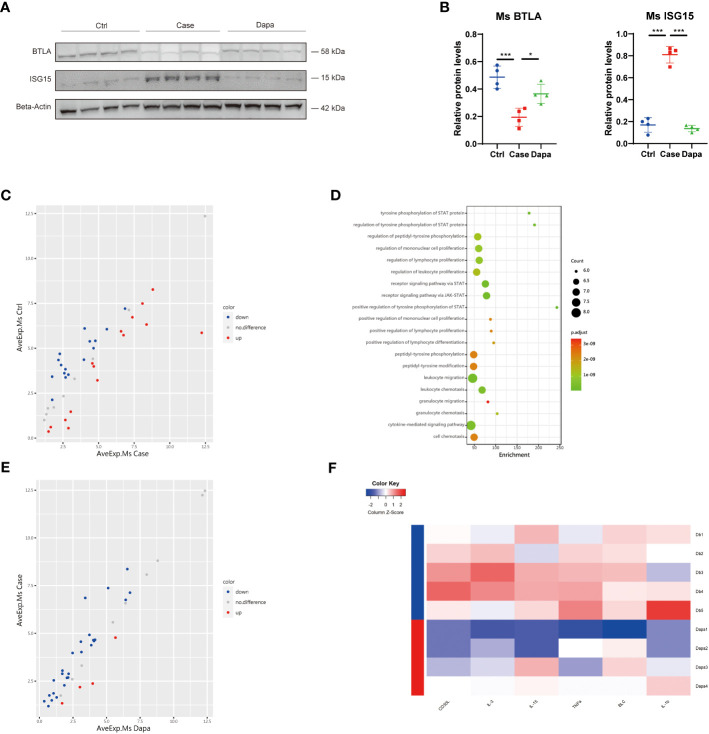
Figure 6.
Dapagliflozin regulated the expression of candidate genes and attenuated renal inflammation in type 2 diabetic mice in vivo. (A) Western blot analysis showing BTLA and ISG15 protein levels in normal (Ctrl), diabetic (Case), and dapagliflozin-treated diabetic (Dapa) mouse kidneys, with corresponding quantifications in (B). (C) Scatter plot indicating distinct protein expression levels of normal versus diabetic mouse kidneys. (D) GO enrichment analysis suggesting leukocyte activation and JAK-STAT pathway activation in diabetic mouse kidneys. (E) Scatter plot indicating distinct protein expression levels of diabetic versus dapagliflozin-treated diabetic mouse kidneys. (F) Heatmap showing different protein levels of inflammatory cytokines in diabetic (Db) and dapagliflozin-treated diabetic (Dapa) mouse kidneys. *P < 0.05, ***P < 0.001, one-way ANOVA test.

