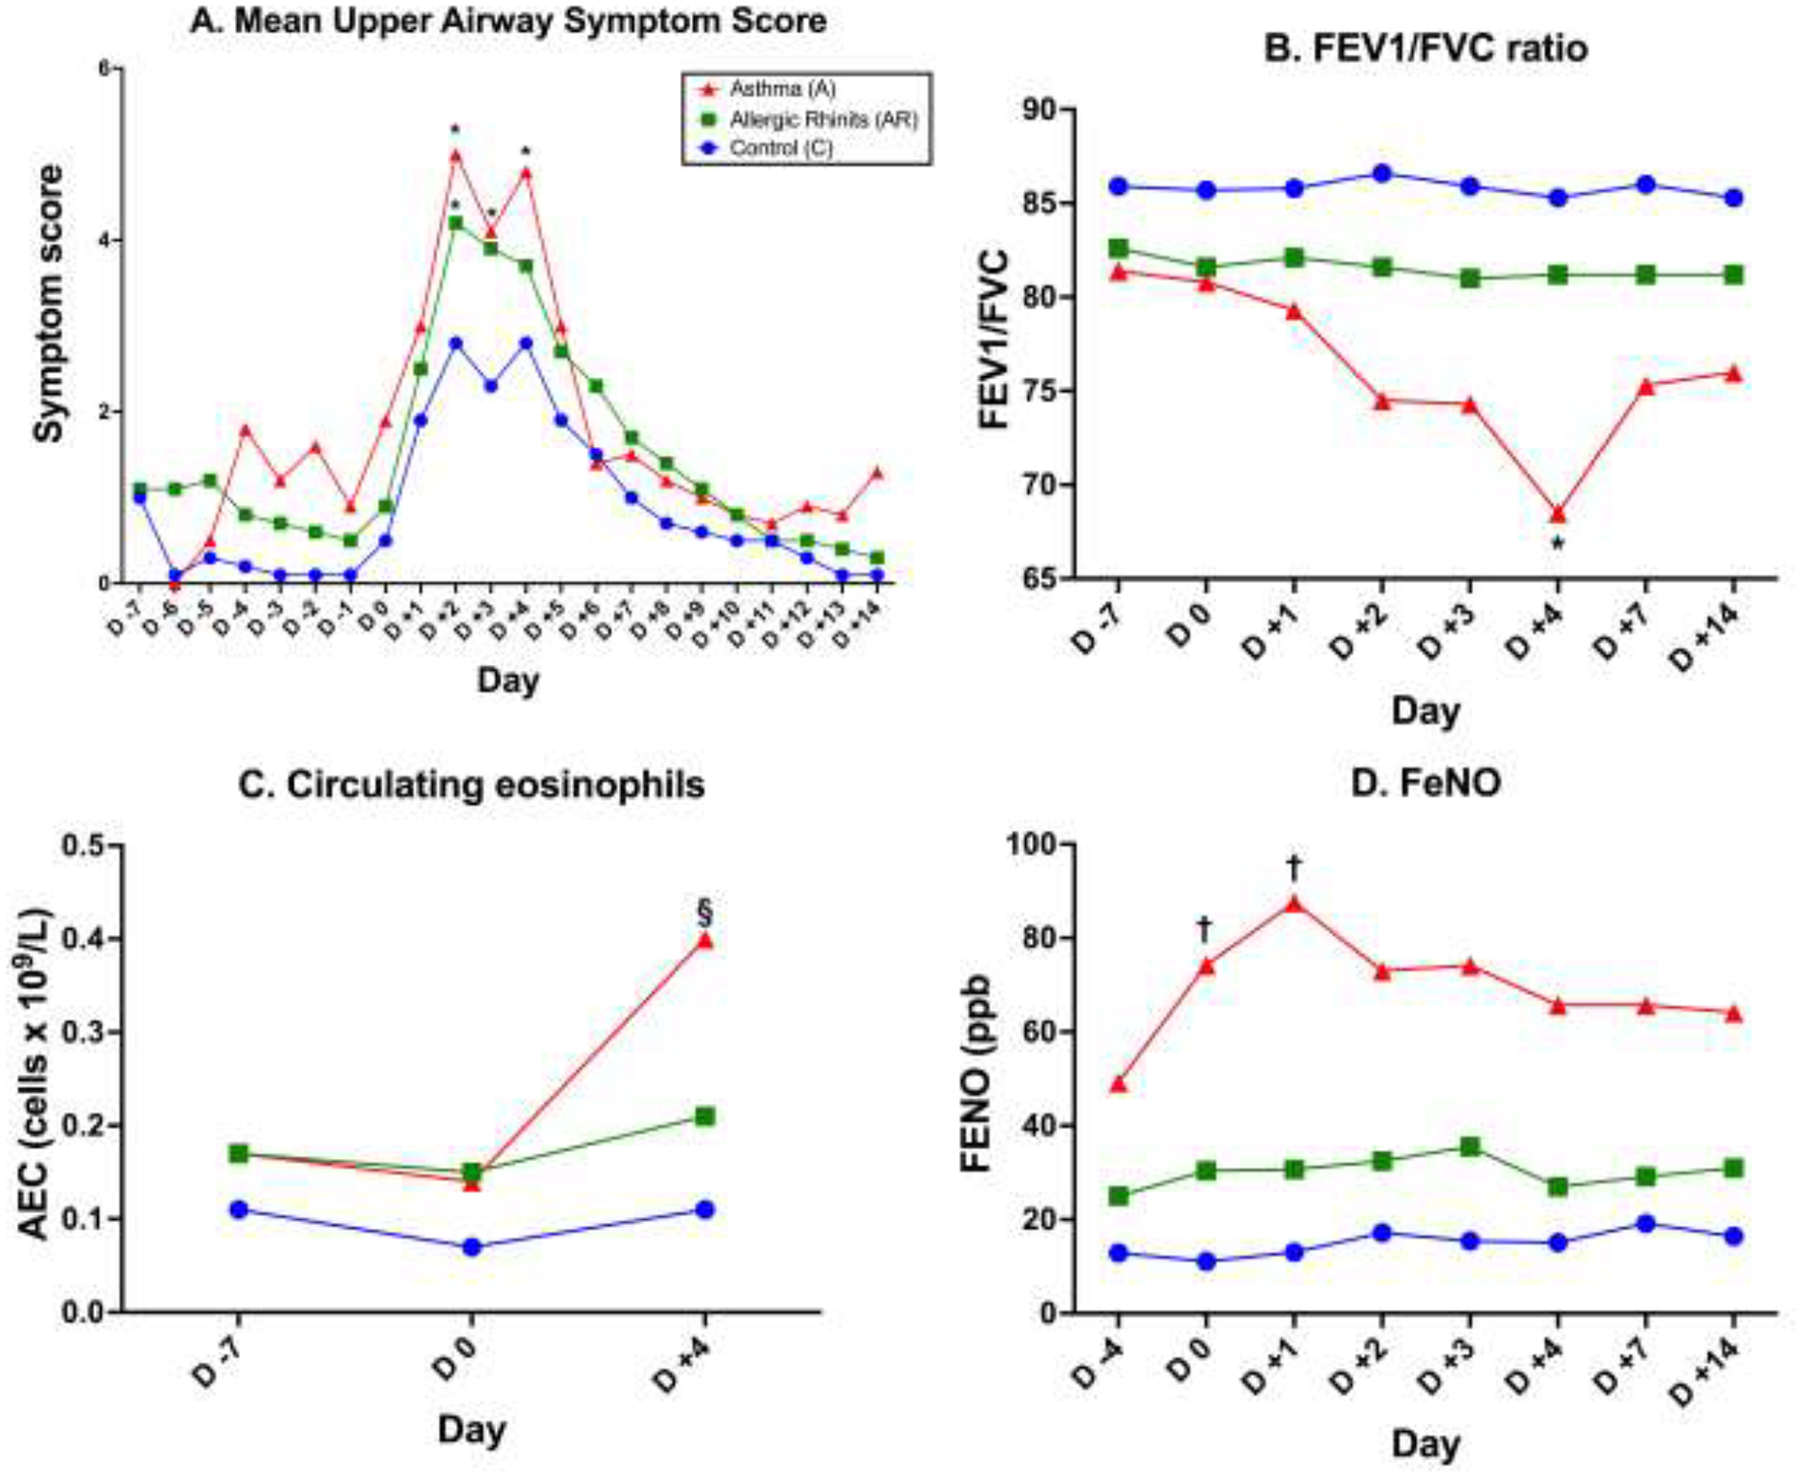
Figure 1:

Clinical response to RV infection. 1A. Upper respiratory symptoms in control (C), AR, and asthmatics (A) post-viral inoculation. 1B. FEV1/FVC ratio. 1C. Circulating absolute eosinophil count. 1D. FeNO. *p<0.05 compared to control subjects; §p<0.01 compared to day 0; †p<0.05 compared to day 0.
