Figure 3.

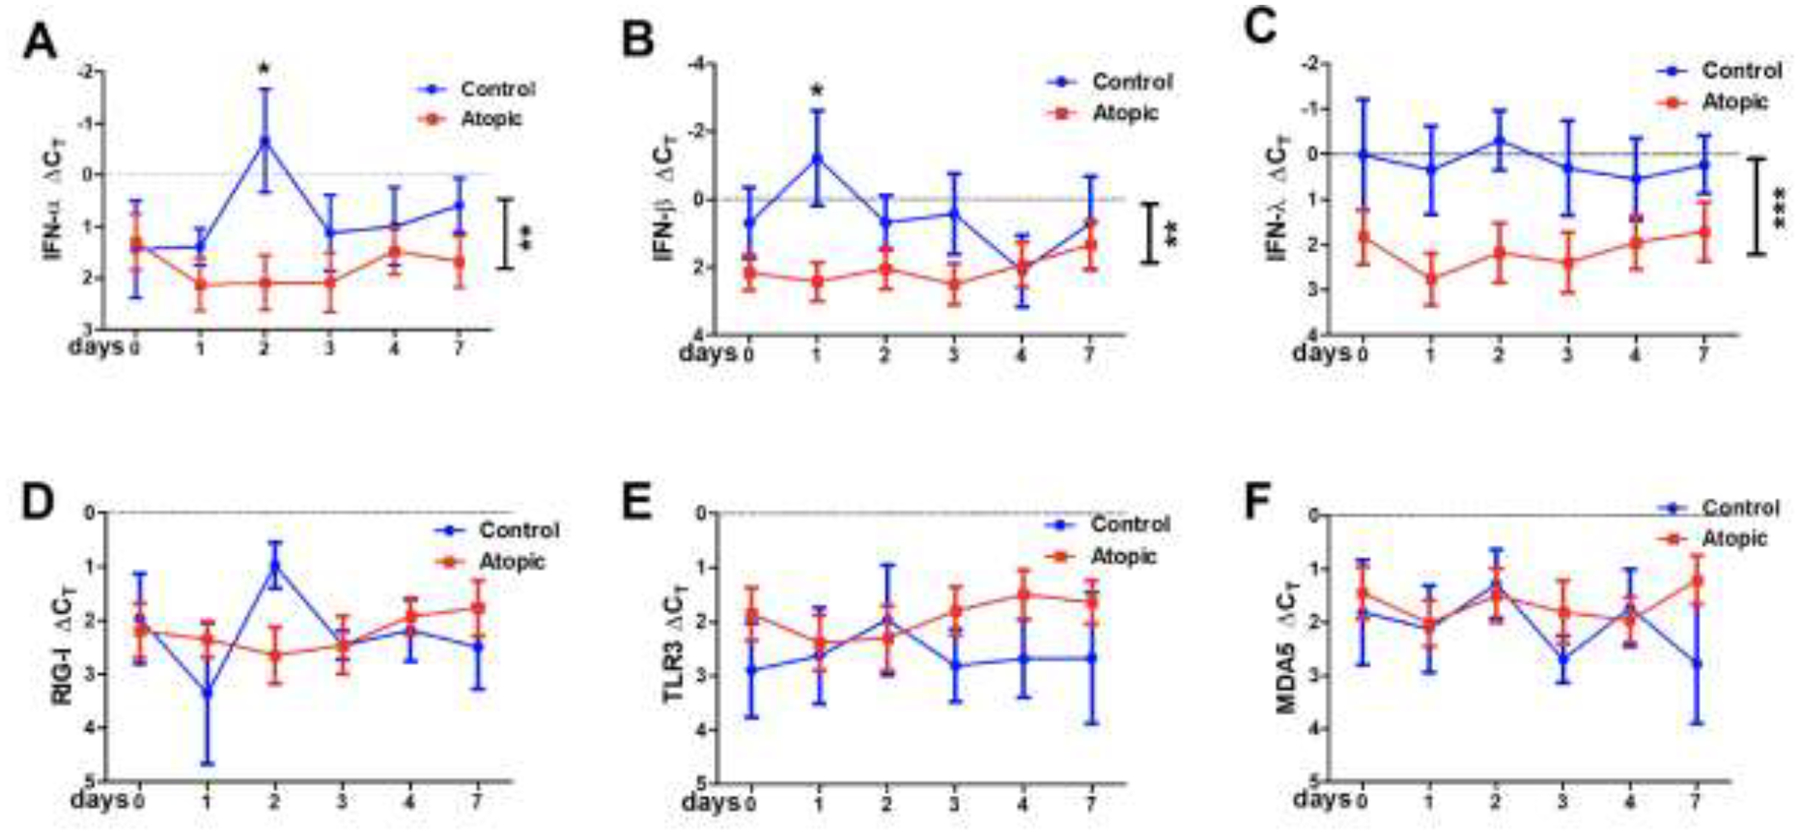
qPCR for RV sensing and responding molecules: 3A – IFN-α, 3B – IFN-ß, 3C – IFN-λ, 3D – RIG-I, 3E – TLR3, 3F – MDA5. Vertical bars on the right of each graph indicate significant difference between the two groups. and the * above, indicate the specific day these differences were significant. *p<0.05, **p<0.01, ***p<0.001.
