Figure 5.

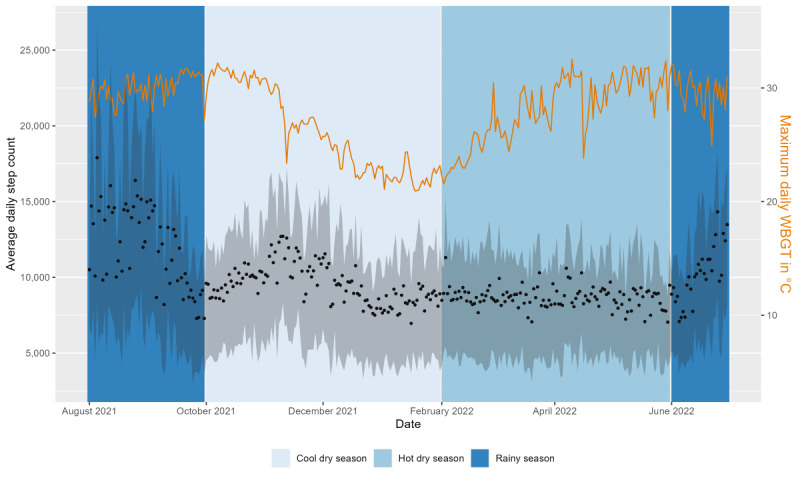
Average daily steps (black dots) with IQR (gray area) and maximum daily wet-bulb globe temperature (WBGT; °C; orange line) for the duration of the study. The background color indicates the 3 seasons (cool dry, hot dry, and rainy).

Average daily steps (black dots) with IQR (gray area) and maximum daily wet-bulb globe temperature (WBGT; °C; orange line) for the duration of the study. The background color indicates the 3 seasons (cool dry, hot dry, and rainy).