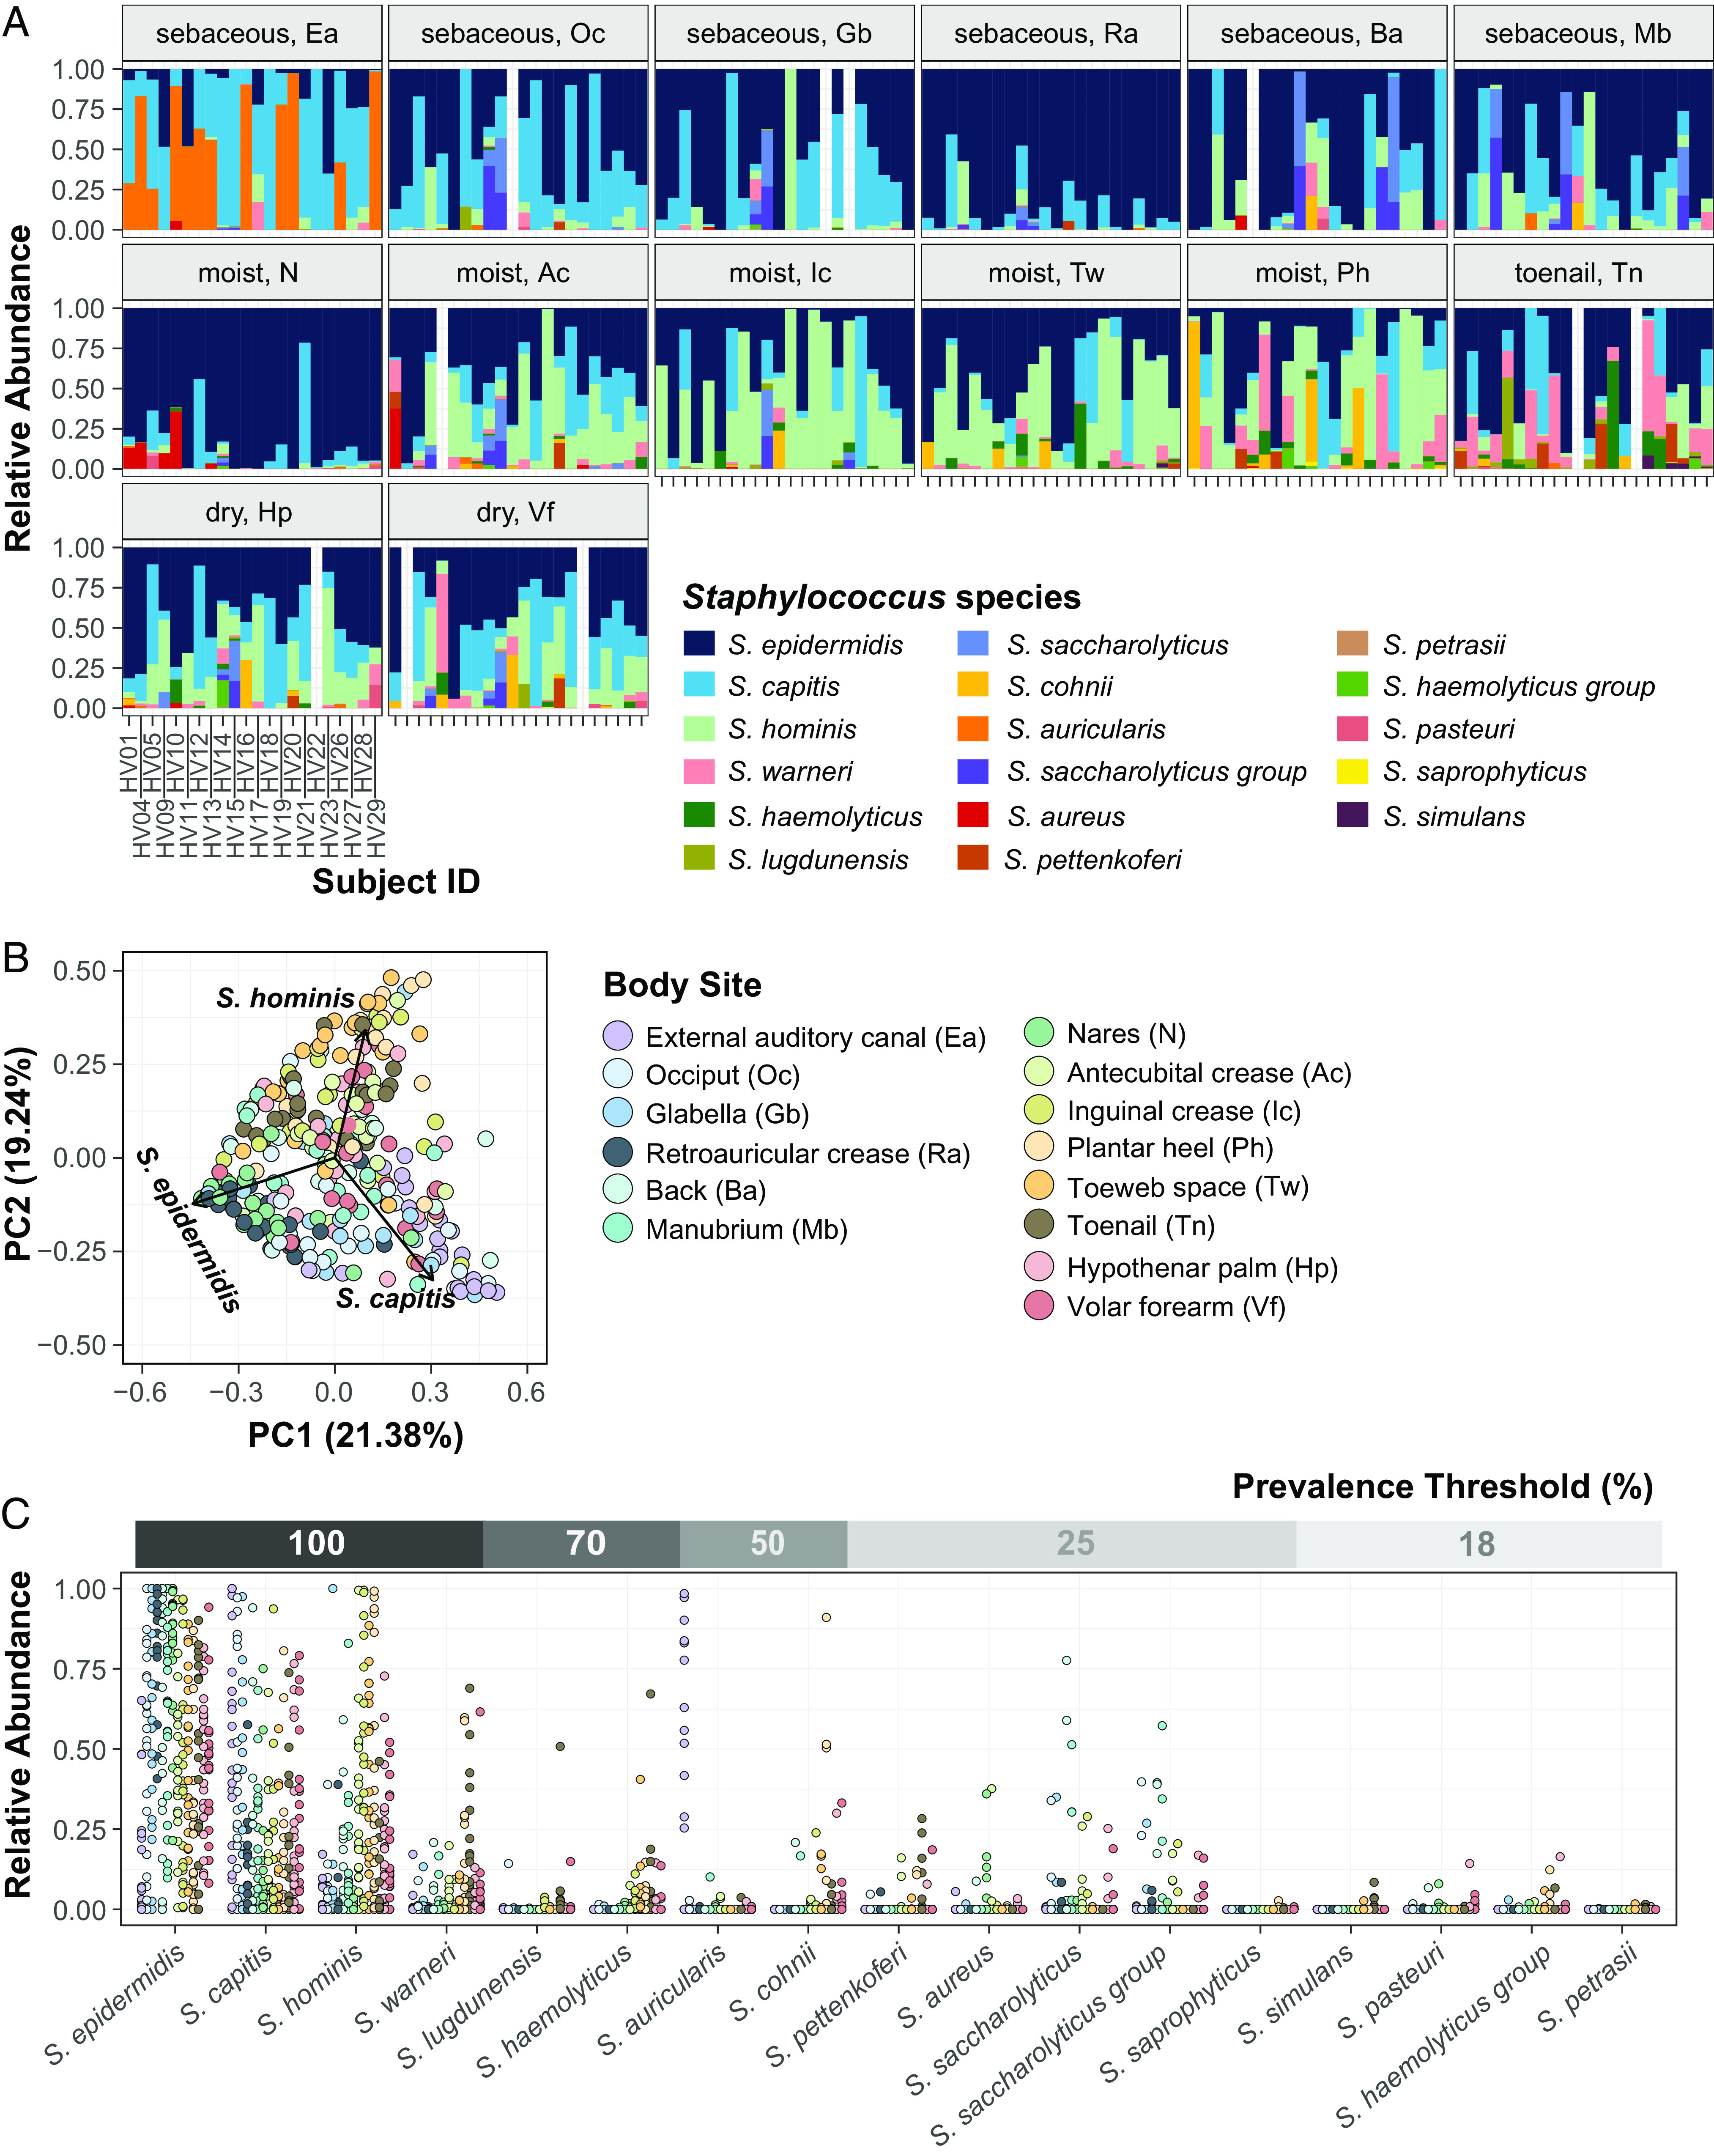
Fig. 1.

Diversity of staphylococcal species present on healthy human skin. (A) Barplots display the relative abundance of staphylococcal species at 14 body sites. Each color represents a distinct species as shown in the legend. Each bar represents one Subject/Healthy Volunteer (HV). Empty bars represent missing data. (B) Beta diversity analysis of staphylococcal communities present at different body sites (displayed as colored dots) using principal-coordinate analysis (PCoA) plot based on Bray–Curtis dissimilarity (PERMANOVA; R2 = 0.26804, P value < 0.0001). First two coordinates are shown accounting for 40.62% of the total variance. Individual staphylococcal ASVs driving the largest separation of body sites are shown as black arrows and are labeled by the corresponding species. Note that the body site legend is shared between figures B and C. (C) Relative abundance and prevalence of staphylococcal species detected in our dataset. Each dot represents proportion of a staphylococcal species relative to all other staphylococcal species in a sample. Dots are colored by body sites as shown in the shared legend. Percent prevalence threshold for a species to be considered part of the core staphylococcal community is shown in the upper gray bar (see text for details). Refer to SI Appendix, Fig. S1 for body site details.
