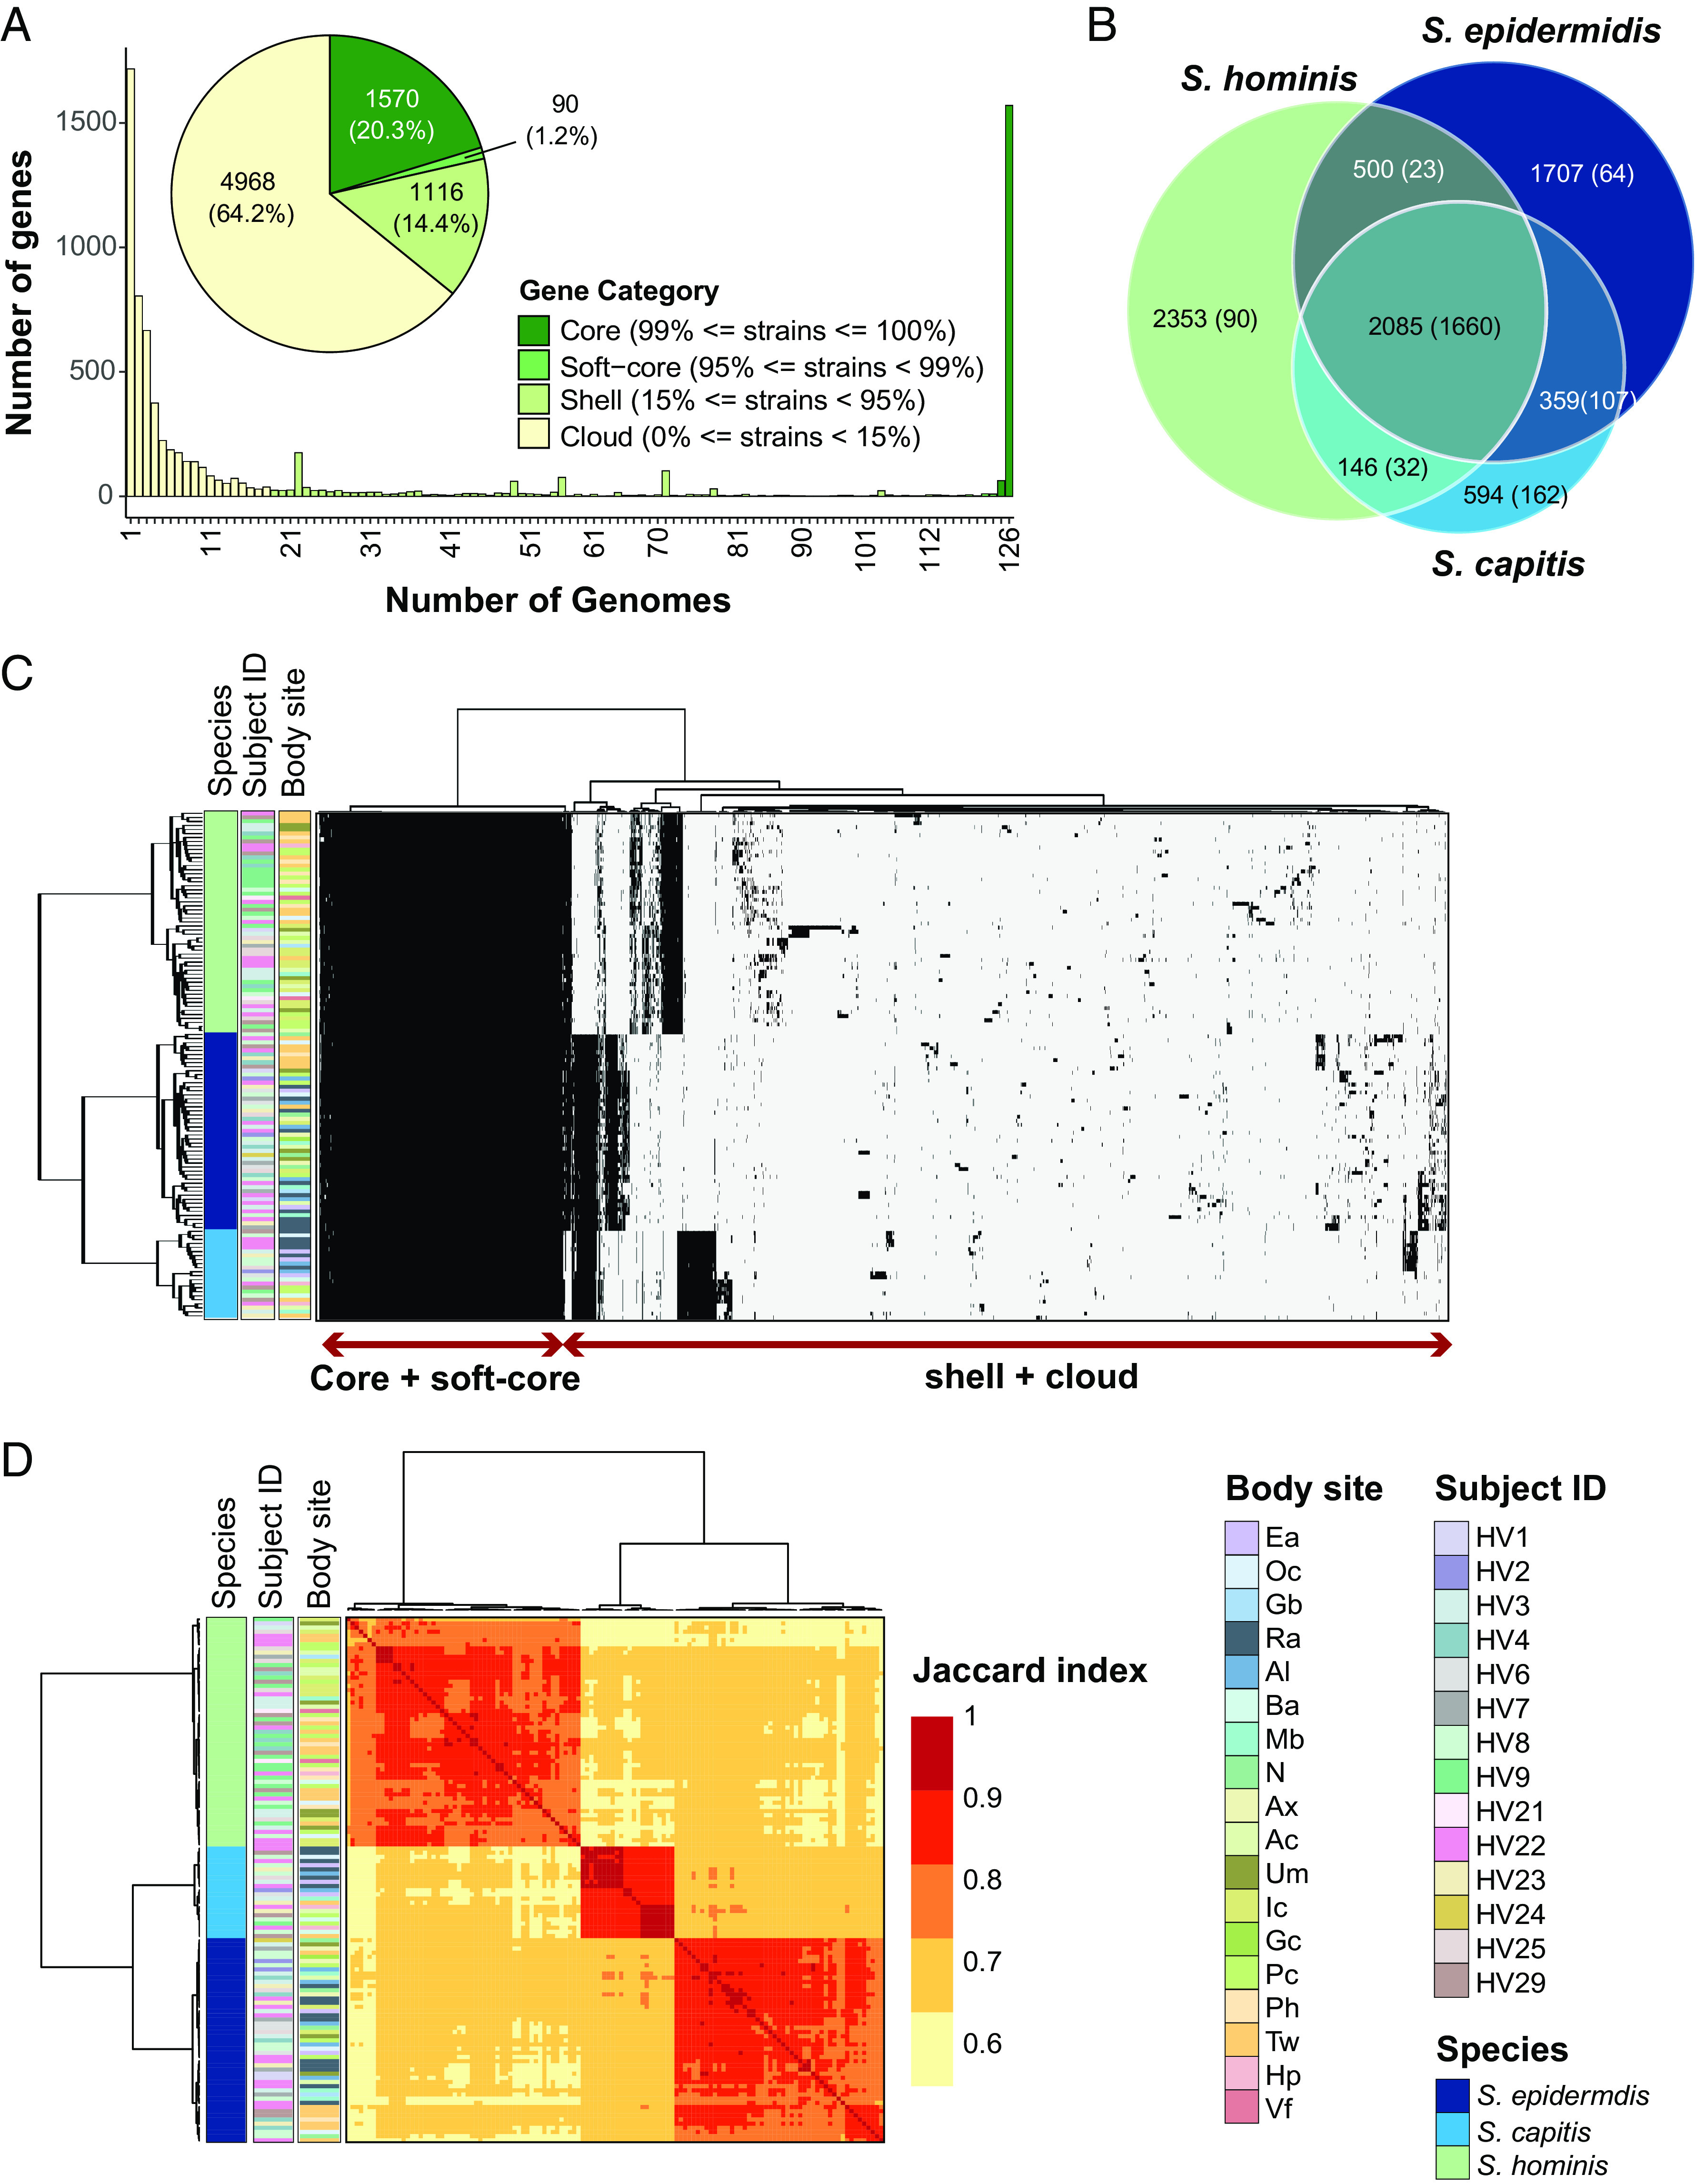
Fig. 2.

Genus-level pan-genome summary to quantify gene sharing between species. (A) Histogram of core, soft-core, shell, and cloud genes of the genus-pangenome. Pie chart shows the number of genes in each category as defined in the legend; percent of genes in each category are displayed in brackets. (B) Venn diagram displaying the distribution of 7,744 genus pan-genome genes into seven subsets based on their presence in one, two or three species. Number of total genes in each subset are shown outside the bracket and the core genes in each sub-set (genes detected in ≥95% genomes present in the sub-set) are shown inside brackets. (C) Clustering of all 126 genomes using Euclidean distance and Ward hierarchical clustering based on the presence/absence patterns of 7,744 genes detected in the pan-genome. Sidebars display species, volunteer, and body site of isolation for each genome. (D) Pairwise Jaccard index between genomes displaying the proportion of shared gene content. Note: Distance of 1.0 depicts complete gene overlap, with lower numbers representing lesser degree of gene sharing. Hierarchical clustering of genomes and the displayed sidebars are the same as that shown in figure C. Note that the legend is shared between figures C and D. Refer to SI Appendix, Fig. S1 for body site details.
