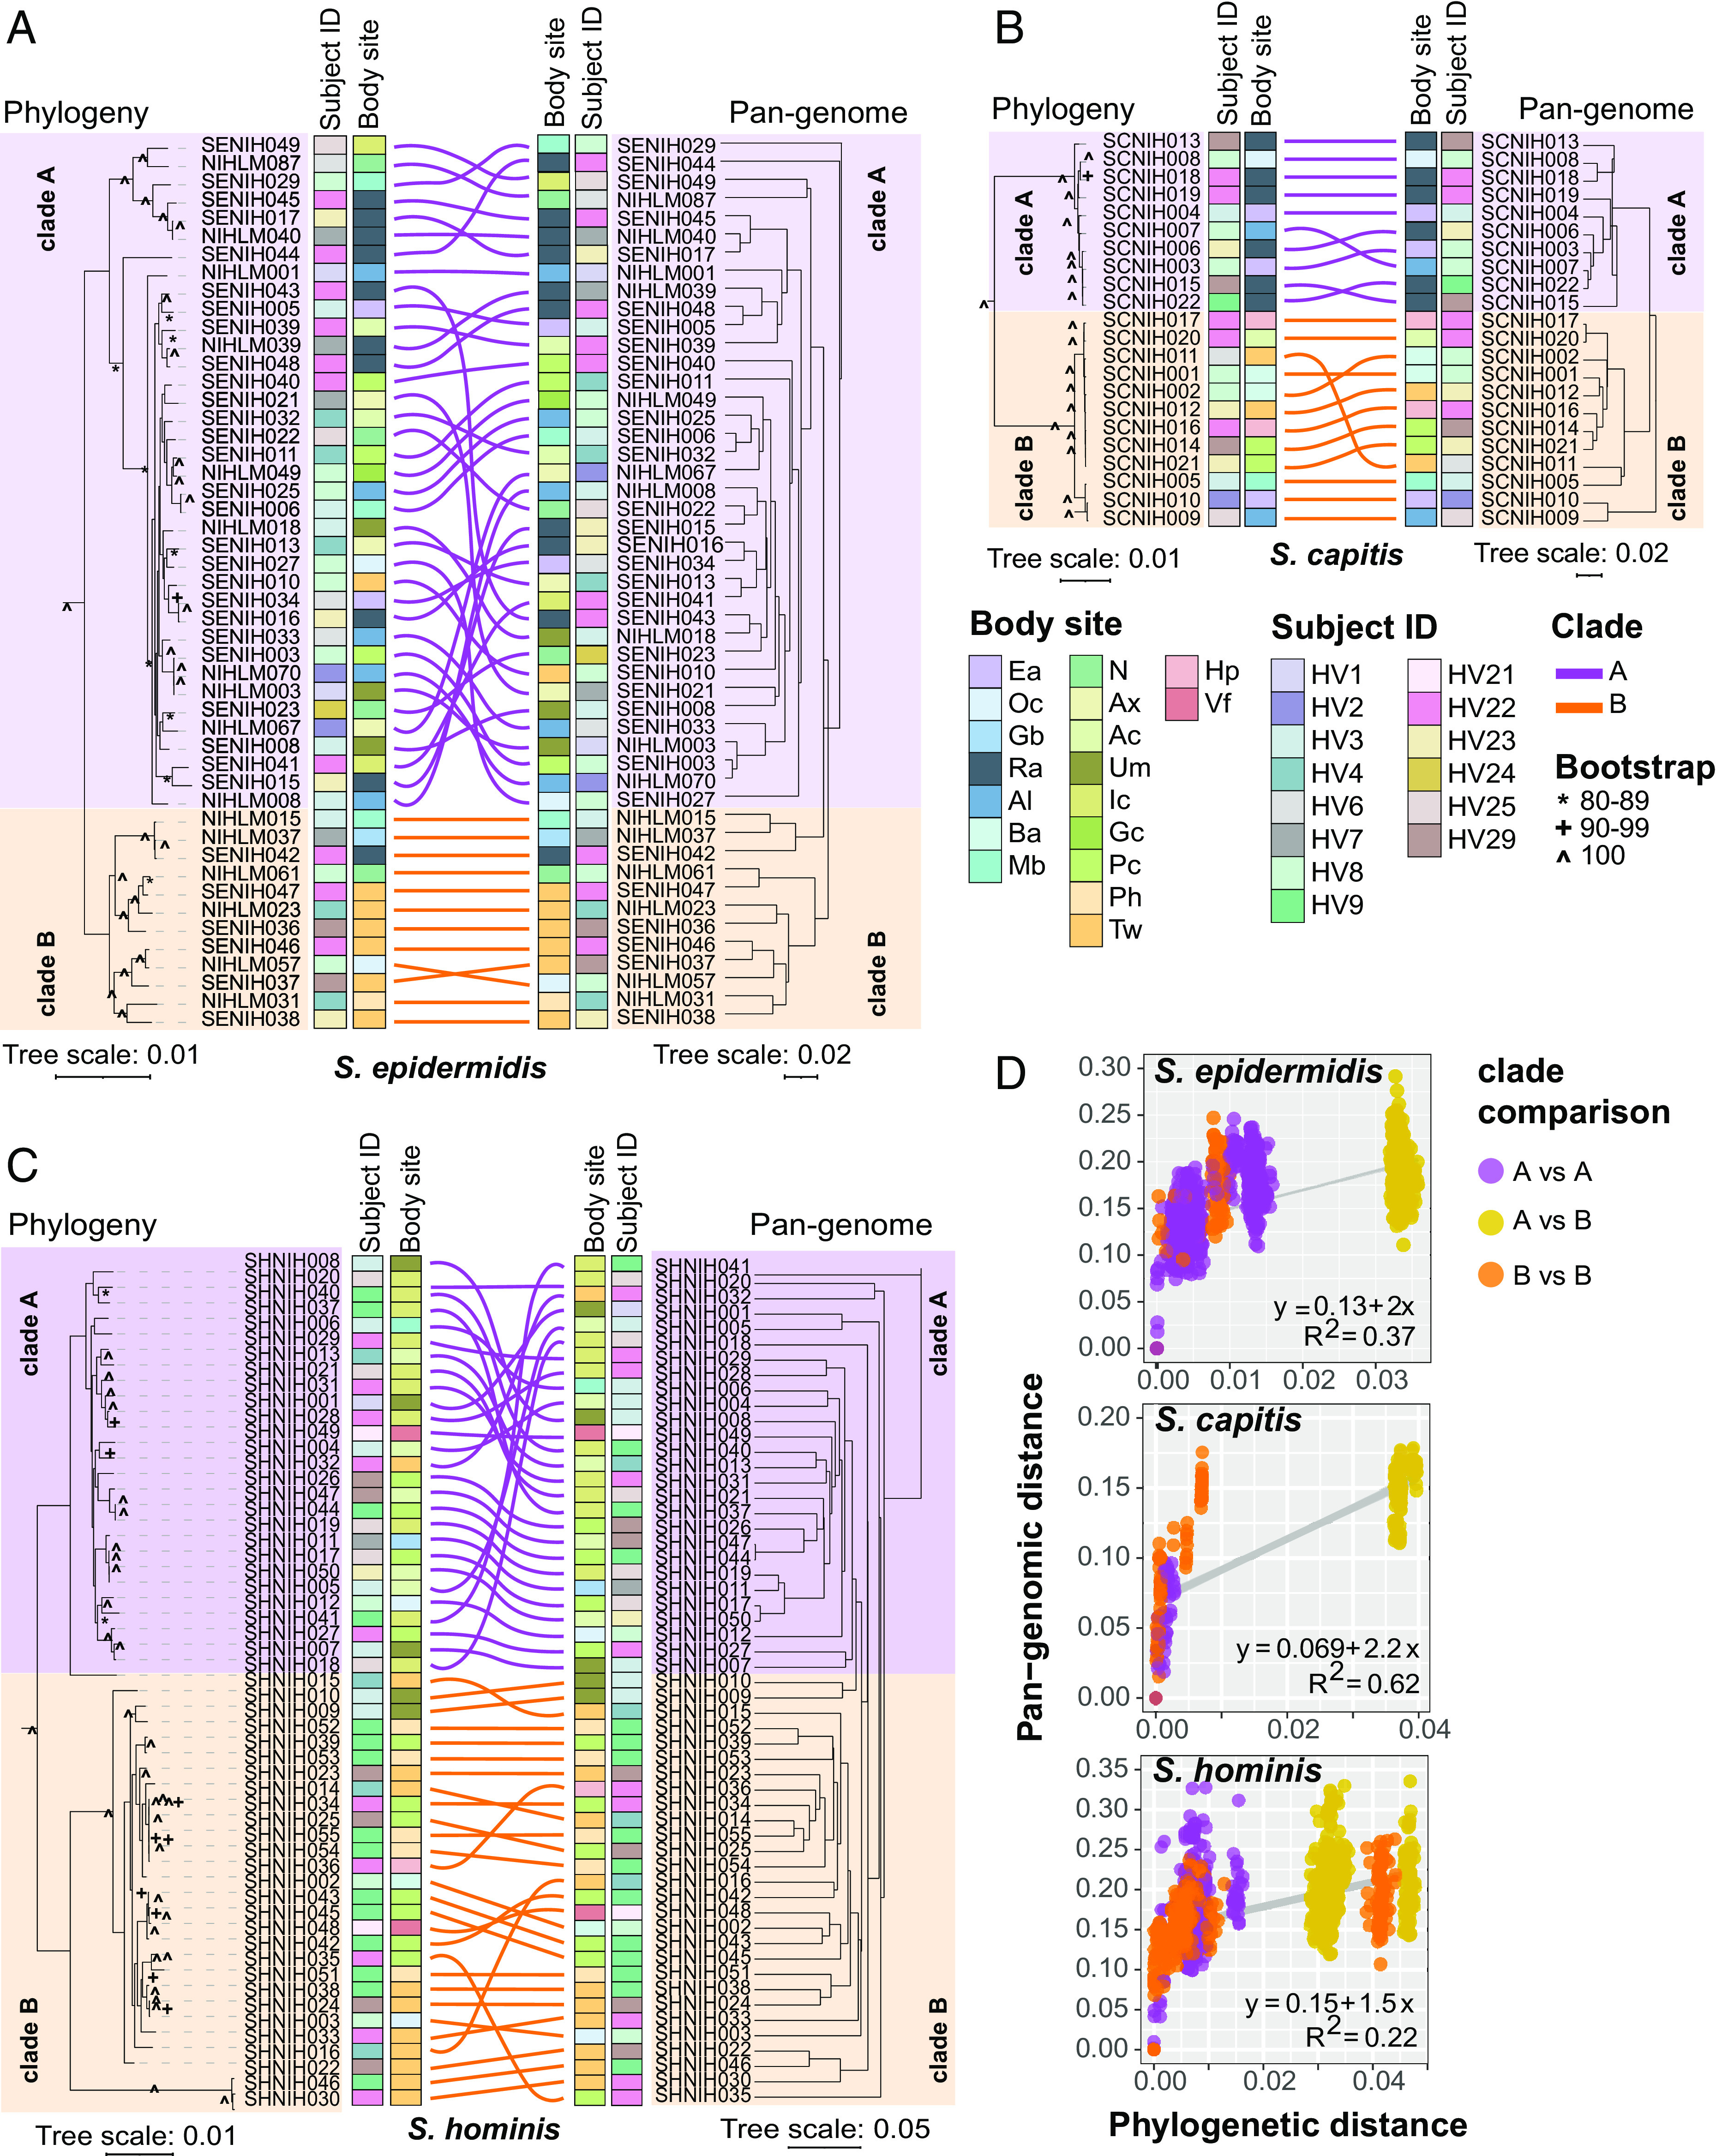
Fig. 3.

Relationship between phylogeny and pan-genome in conspecific staphylococcal genomes. (A–C) Tanglegrams depicting the relationship between the phylogenetic tree based on core genes sequence alignment (Left) and hierarchical clustering (binary distance; average linkage) of the pan-genome presence/absence matrix (Right). Clades A and B, as determined by rooting each species tree with an outgroup using a genus tree (SI Appendix, Fig. S9), are shown in purple and orange color, respectively. Colored lines are used to connect the same isolate on two trees of the tanglegram. Healthy volunteers and body sites of isolation for isolates are displayed as colored strips within the tanglegram. (D) Correlation between phylogenetic distance and pan-genome distance for all pair-wise genome comparisons within a species. Each dot represents one pair-wise comparison. Dot colors represent the clades to which the genomes being compared belong, with yellow color dots representing clade A versus clade B comparison. Refer to SI Appendix, Fig. S1 for body site details.
