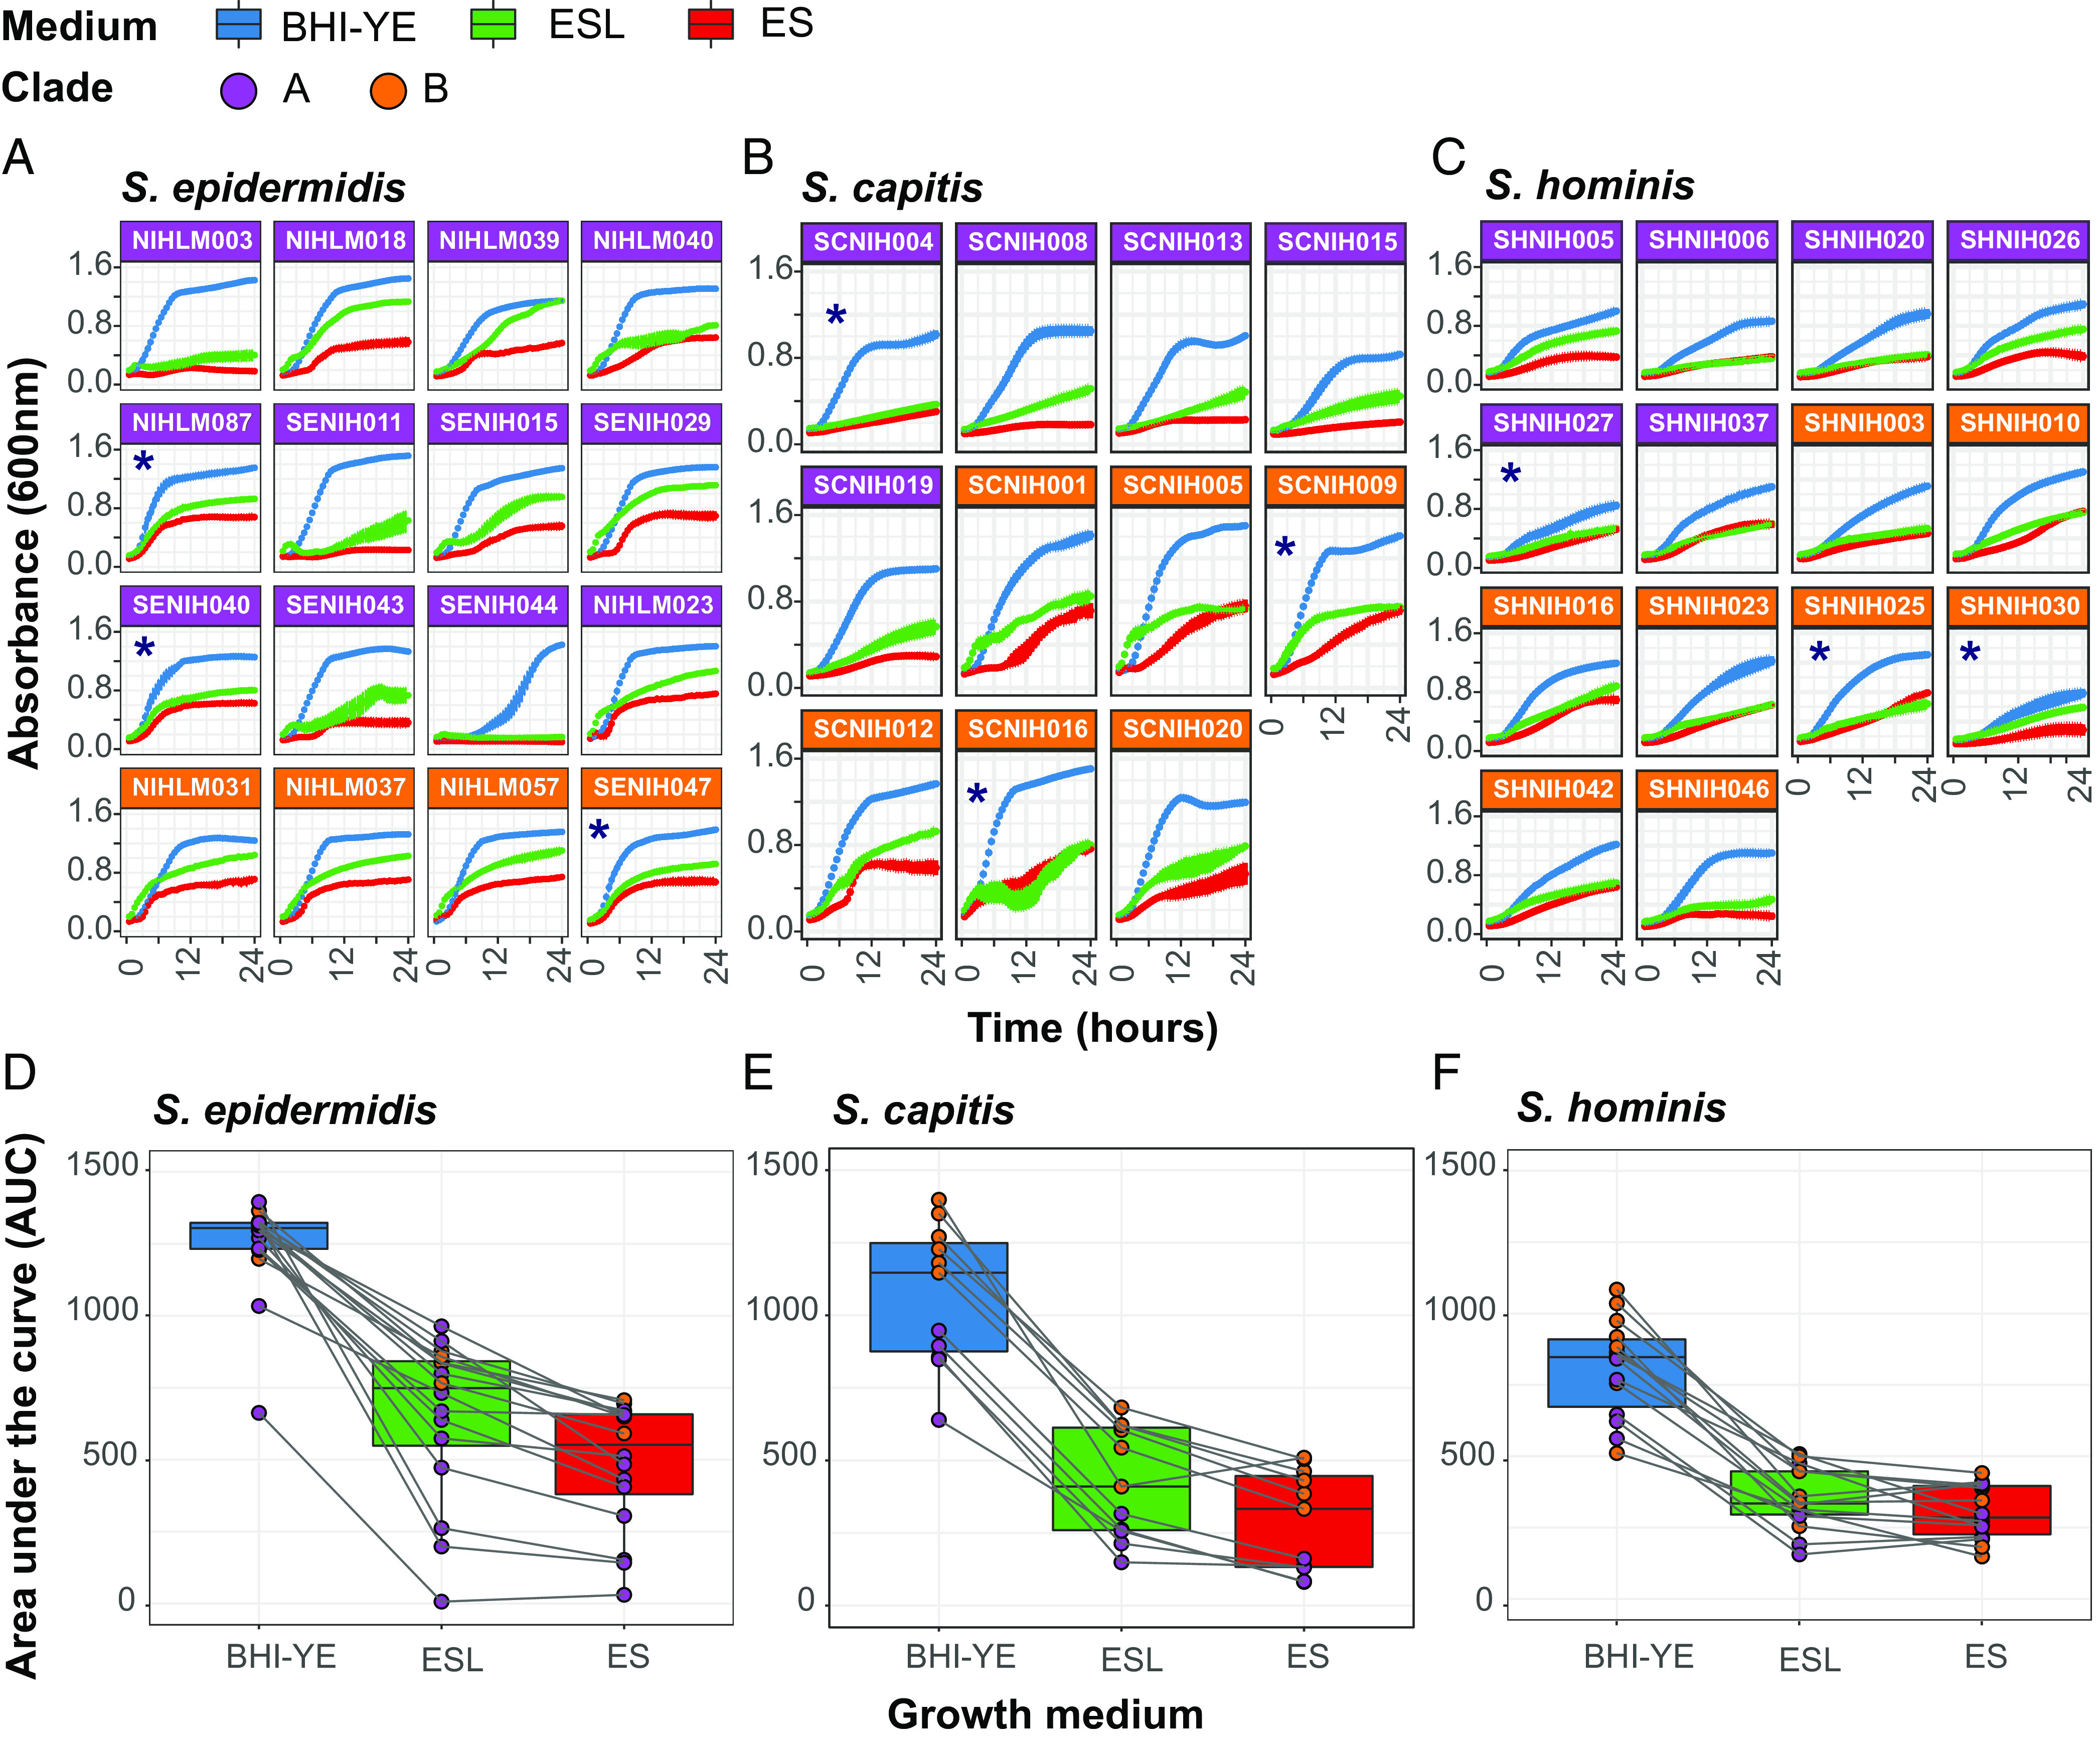
Fig. 4.

Kinetic growth analyses of select staphylococcal isolates in BHI-YE and artificial skin media, ES and ESL. (A–C) Growth curves of select S. epidermidis, S. capitis, and S. hominis isolates grown independently in three culture media, as measured by absorbance at 600 nm over 24 h. Each growth curve is an average of four independent biological replicates; error bars for each curve are shown. Isolates marked with an asterisk (*) were selected for RNA-Seq analyses. Purple and orange color of facets indicate the phylogenetic clade to which each isolate belongs. Growth curve color represents the growth medium. (D–F) The AUC was used to quantify the growth of each isolate shown in A–C. Boxplots depict combined AUC values for all isolates of a species in each growth medium, as depicted by the color of the boxplot. The center black line within each boxplot represents the median value, with edges showing the first and third quartiles. Individual AUC values are shown as dots colored by clade of the isolate. Note that the legend is shared between all figures.
