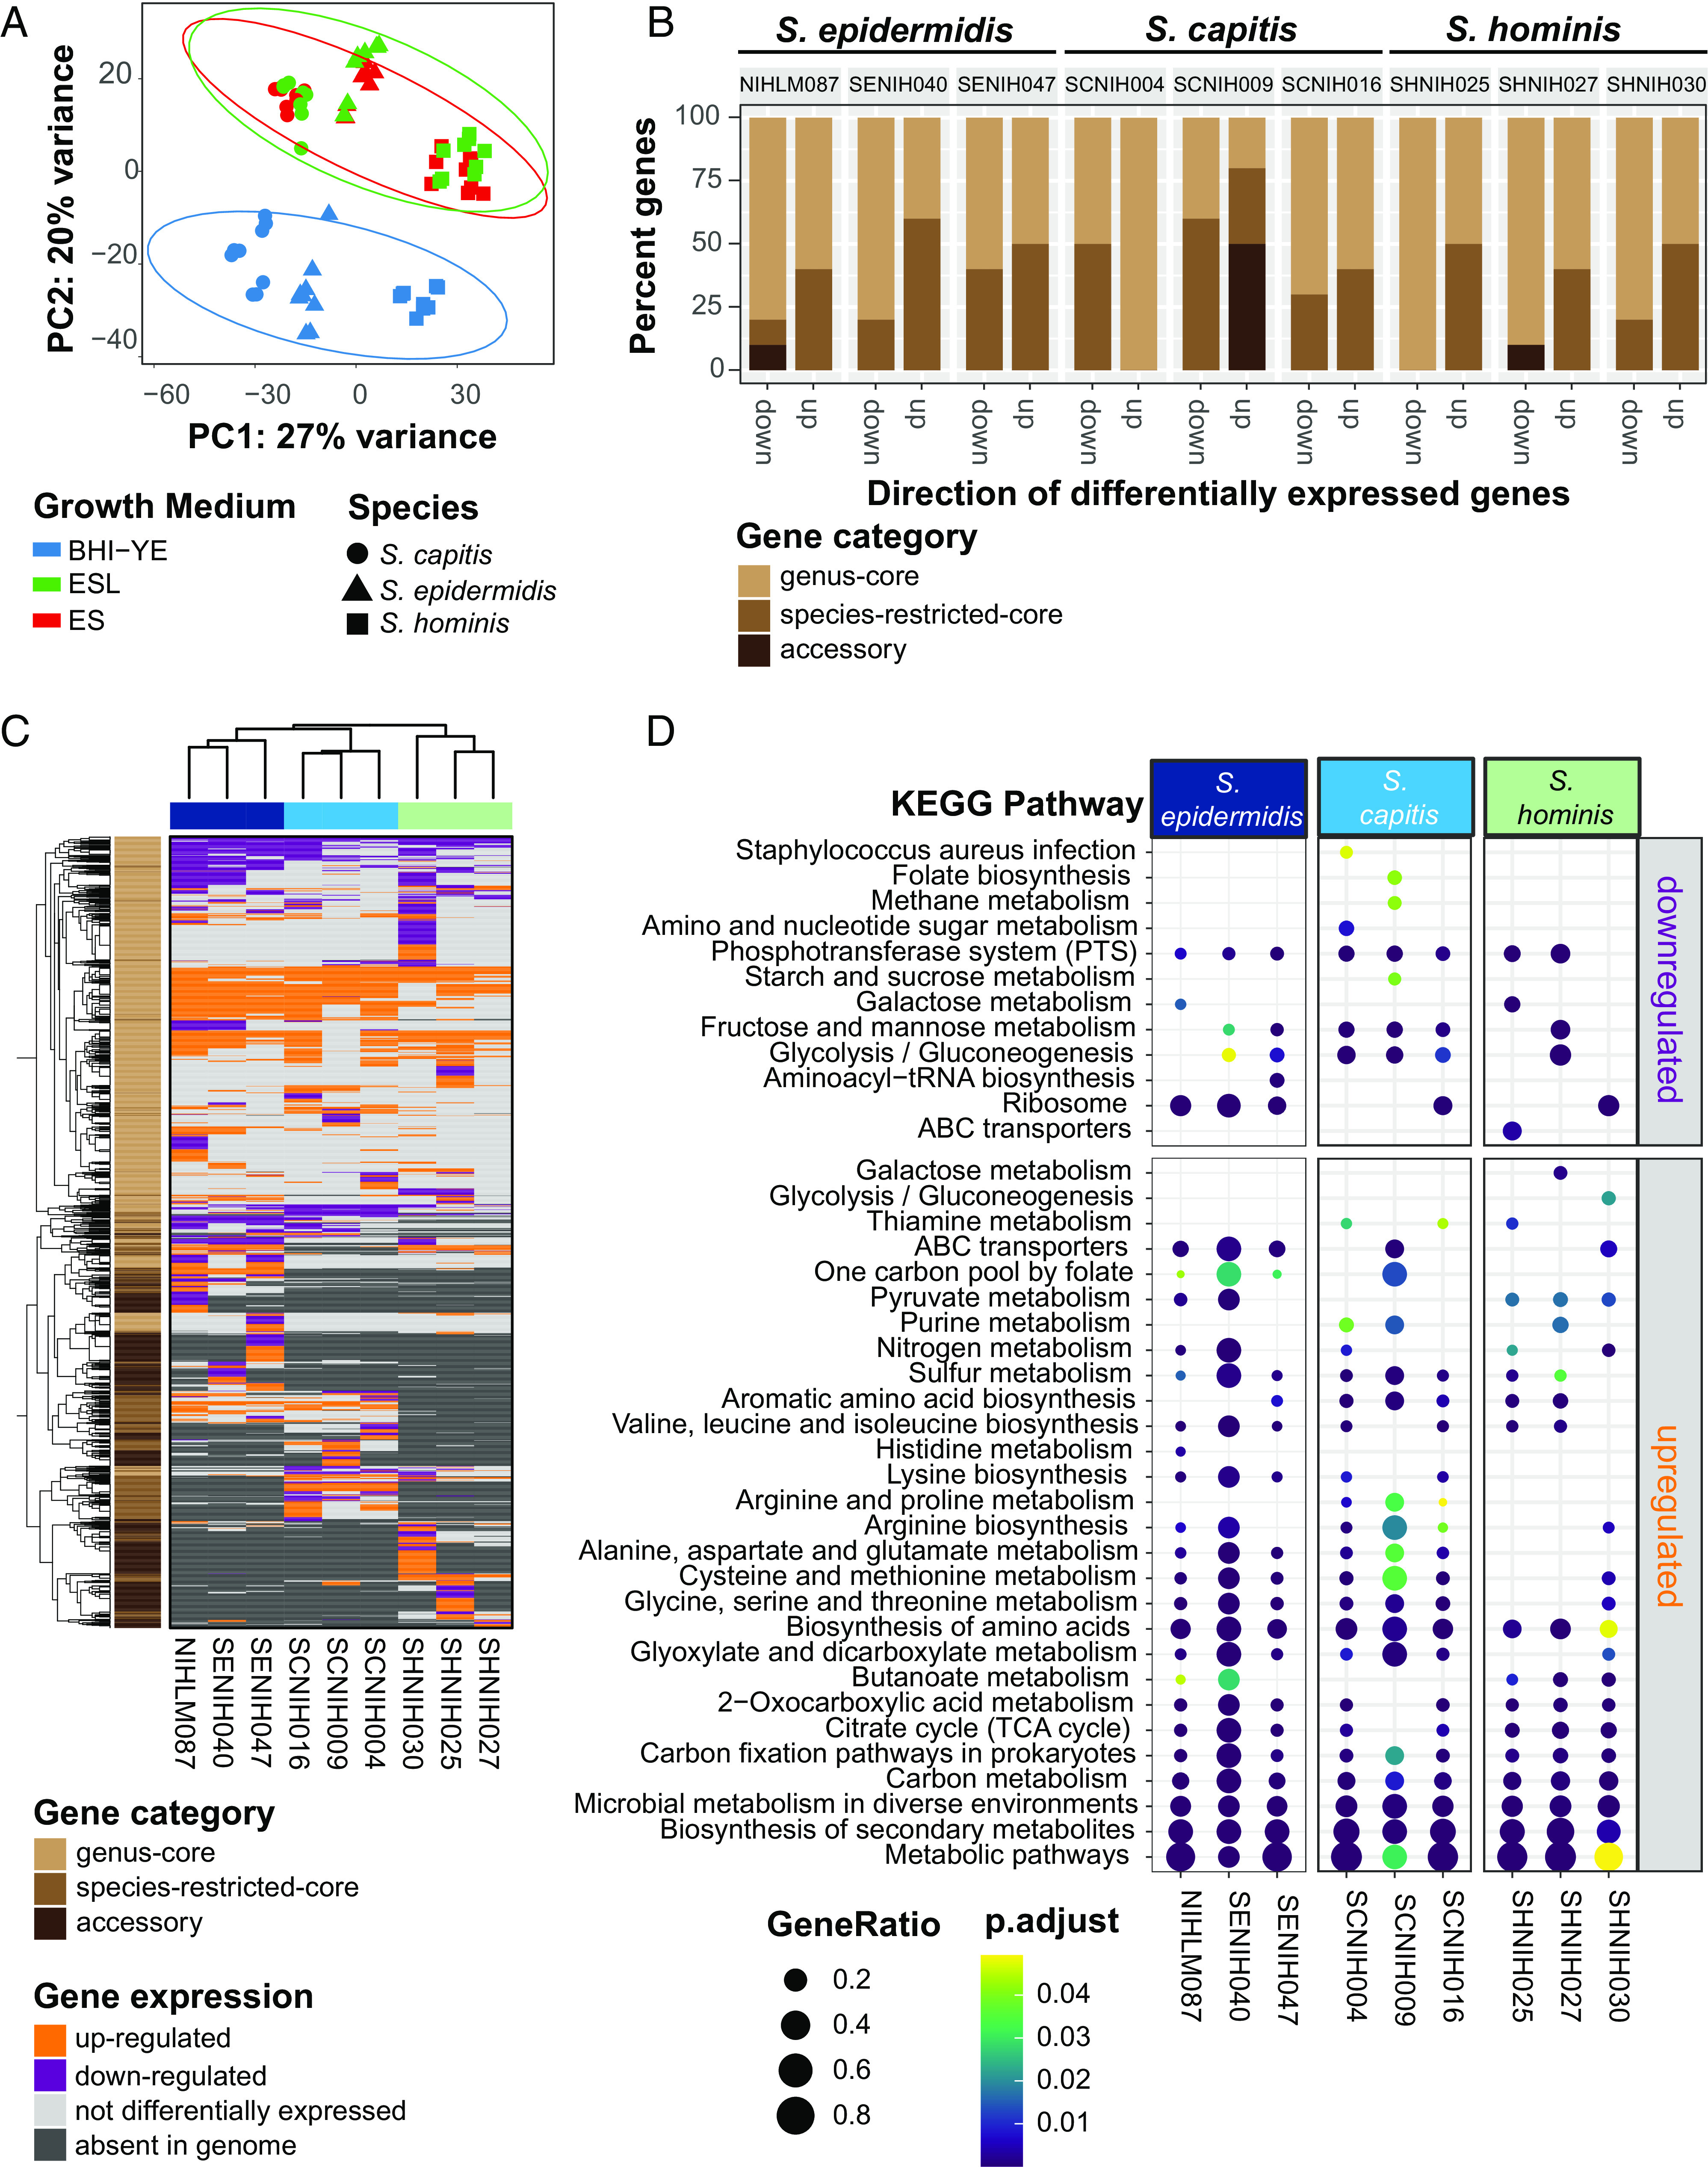
Fig. 5.

RNA-Seq analysis of nine distinct staphylococcal isolates in BHI-YE and in artificial skin media, ES, and ESL (N = 3 biological replicates). (A) Principal-component variance stabilizing transformation-normalized reads from all RNA-seq samples with 1,647 genus-core genes. Colors represent different growth media, and shapes represents staphylococcal species. (B) A stacked bar plot representing the proportion of genus-core, species-restricted-core, and accessory within the top 10 down- and up-regulated genes in each isolate in the ES medium relative to BHI-YE. (C) A discrete heatmap of log2-fold changes of all the genes that were differentially expressed (≥ or ≤ twofold change, adjusted P value < 0.05) in ES relative to BHI-YE. Columns are individual isolates and rows are DEGs. Genes up-regulated in the ES medium are shown in orange, down-regulated genes are in purple. Light gray cells represent genes that were encoded within an isolate genome, but not differentially expressed in that isolate. Dark gray cells denote genes that were absent in the isolate genome. The left sidebar depicts the category to which each gene belongs. Top and side dendrograms were generated by unsupervised clustering of the expression data (Euclidean distance; Ward). (D) KEGG pathway enrichment analysis of DEGs in ES medium relative to BHI-YE in each isolate. The X axis and Y axis show the isolate and pathway, respectively. Bubble size shows GeneRatio and color indicates adjusted P value.
