
Fig. 2 |. Detection of polyclonal CD4+ T cells from immunized mice using p:I-Ab-4E tetramers.
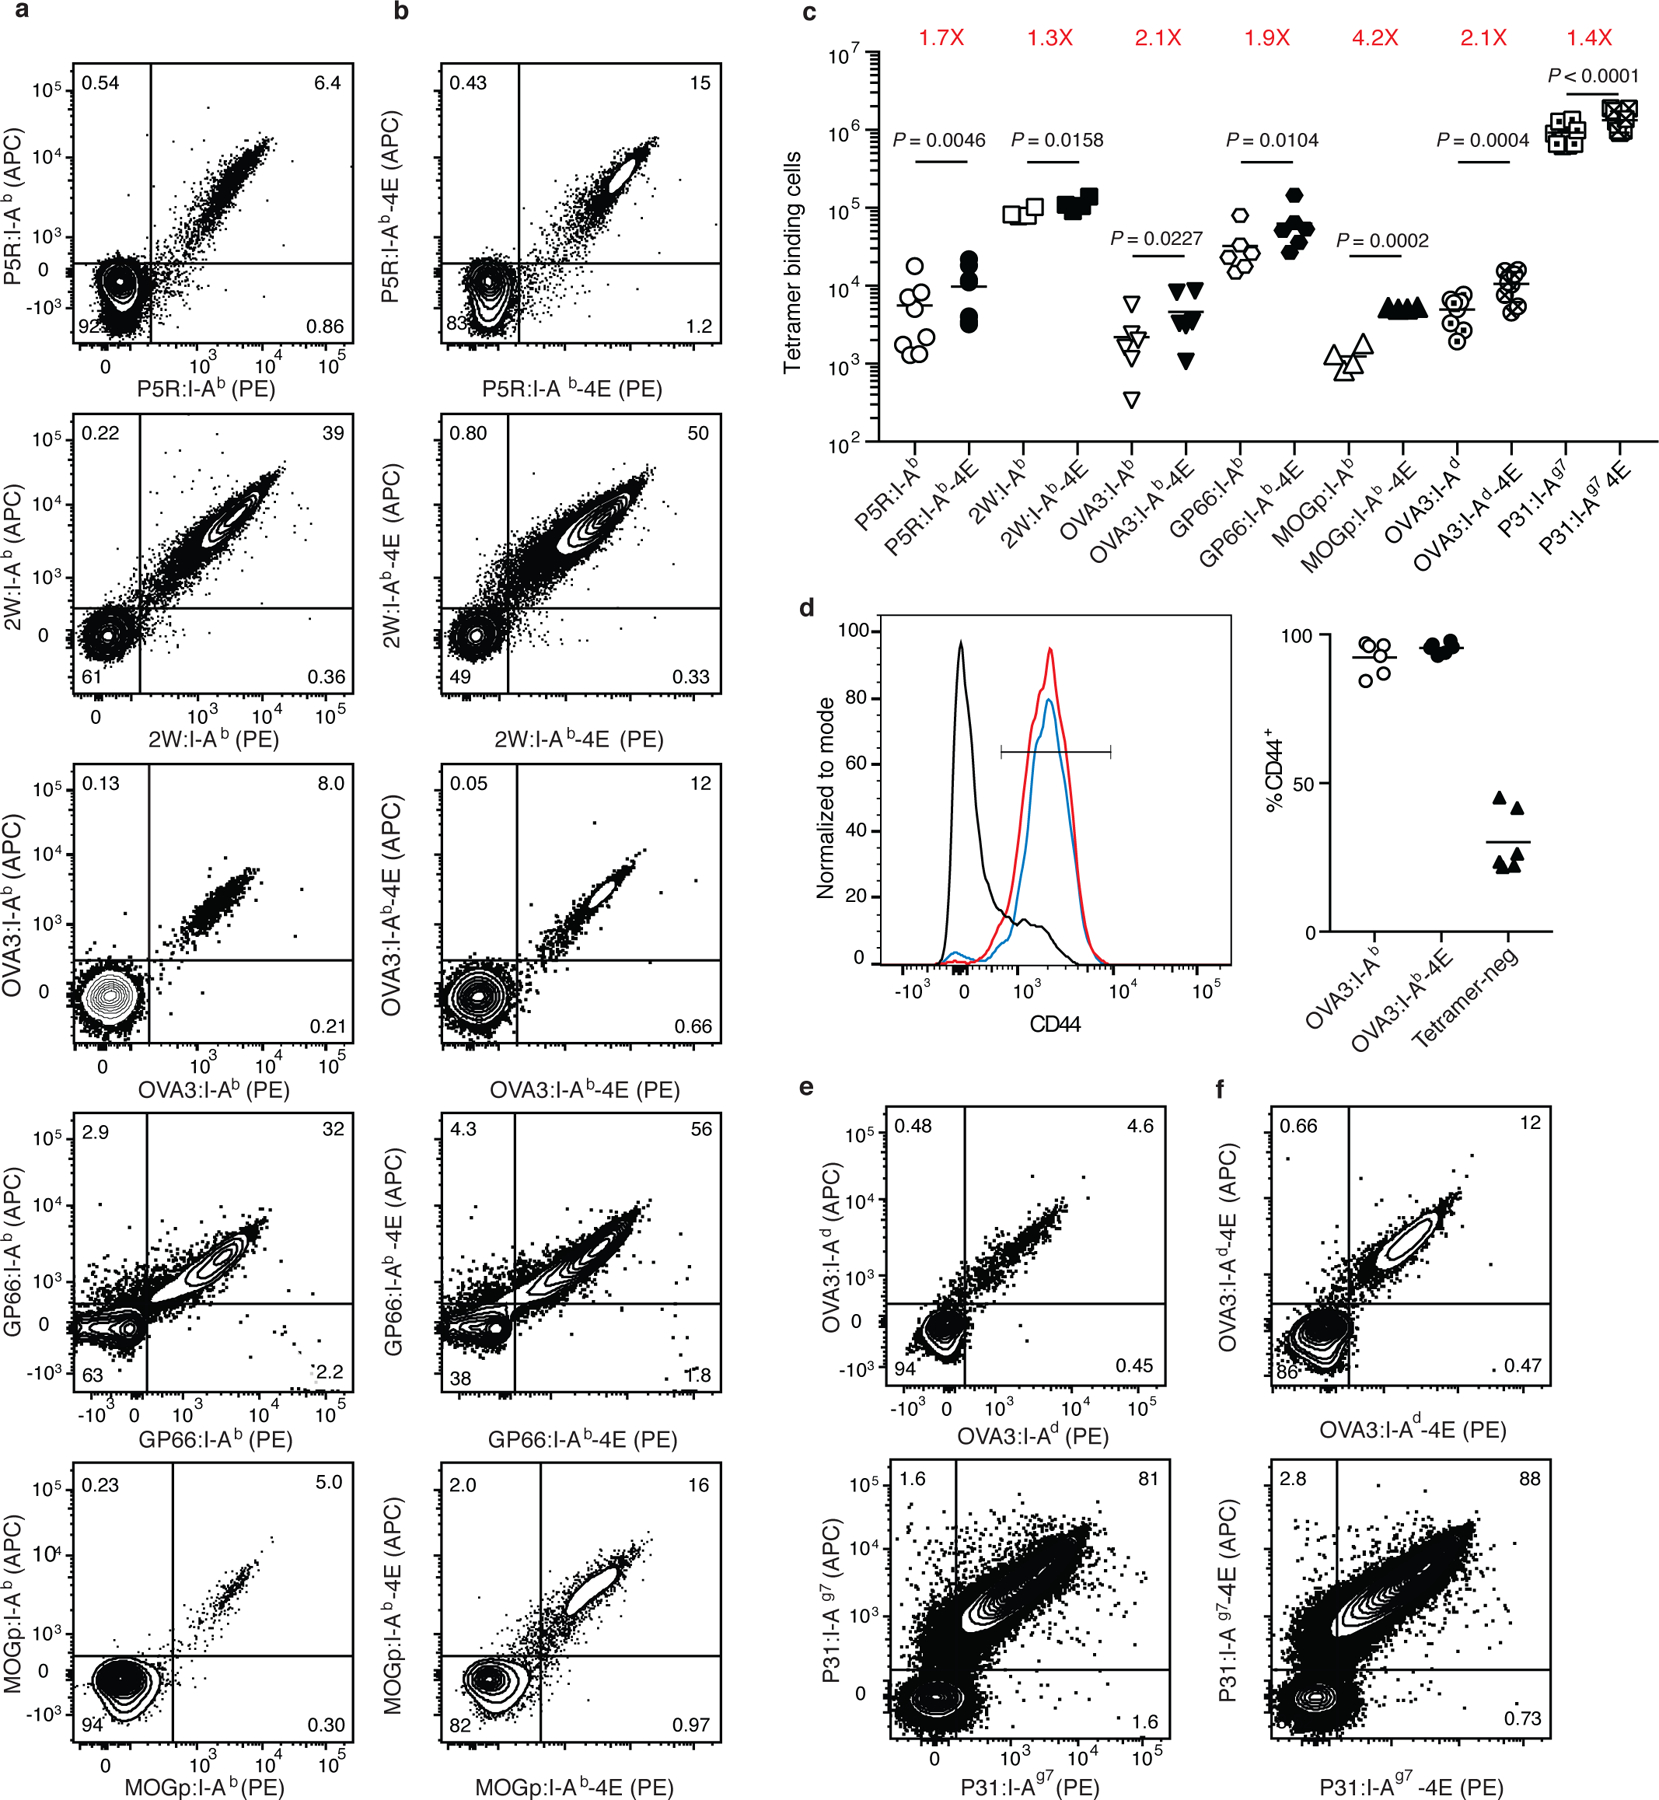
a-c, Representative flow cytometry contour plots of CD4+ T cells in split samples from the spleen and lymph nodes of individual B6 mice immunized with P5R, 2W, OVA3, GP66, or MOGp peptides in CFA seven days earlier, after enrichment with either p:I-Ab (a) or p:I-Ab-4E (b) tetramers. c, Scatter plots showing the number of CD4+ T cells detected with the indicated tetramers in split samples from individual mice (n = 4–9, from 2 independent experiments) with horizontal bars at the mean values. Mean values were compared with a paired Students t-test. P values are shown for each pair. d, Representative flow cytometry histograms of CD44 expression by OVA3:I-Ab (red), OVA3:I-Ab-4E (blue) or tetramer-negative (black) CD4+ T cells from B6 mice immunized with OVA peptide in CFA, and a scatterplot of the percentage of the T cells in the indicated populations that had a CD44high activated phenotype. e, f, Representative flow cytometry contour plots of CD4+ T cells in split samples from the spleen and lymph nodes of individual BALB/c (top row) or NOD (bottom row) mice immunized with OVA3 or P31 peptides in CFA seven days earlier, after enrichment with either p:I-Ab or p:I-Ag7 (e) or p:I-Ab-4E or p:I-Ag7-4E (f) tetramers.