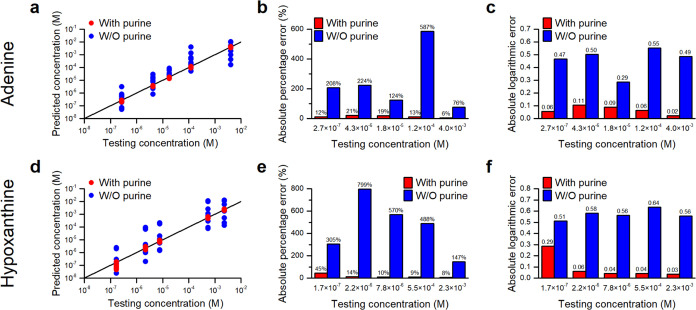
Figure 4.
Prediction capability of the calibration curves with and without purine IS for various concentrations of (a–c) adenine and (d–f) hypoxanthine. (a, d) Predicted concentrations vs tested concentrations, (b, e) average absolute percentage errors, and (c, f) average absolute logarithmic errors.

