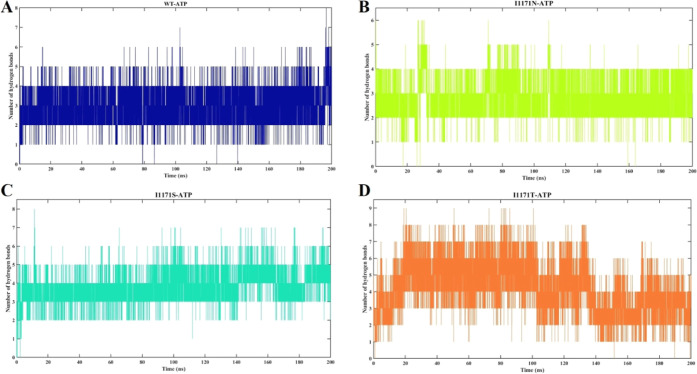
Figure 7.
Intermolecular hydrogen bond analysis of ALK WT and I1171N/S/T mutations with ATP over the 200 ns MDS. The X-axis denotes the time in nanoseconds, and the Y-axis displays H-bonds in number. The intermolecular hydrogen bond analysis for (A) WT-ATP showed navy blue, (B) I1171N-ATP in pear, (C) I1171S-ATP in cyan, and (D) I1171T-ATP in orange.

