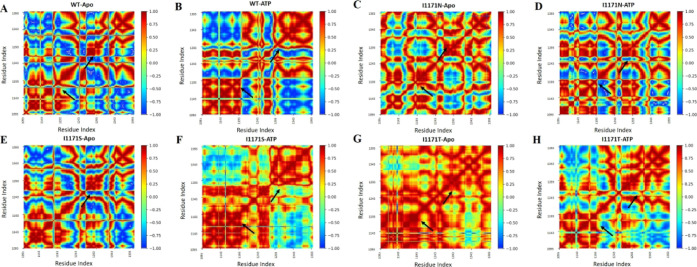
Figure 9.
DCCM of the backbone atoms around their mean positions of ALK (A) WT-Apo, (B) WT-ATP, (C) ALK I1171N-Apo, (D) I1171N-ATP, (E) ALK I1171S-Apo, (F) I1171S-ATP, (G) I1171T-Apo, and (H) I1171T-ATP. The color bar varies from red to blue (+1 to −1), which represents the level of correlation and anticorrelation movements. The significant change in DCCM is highlighted with arrows.

