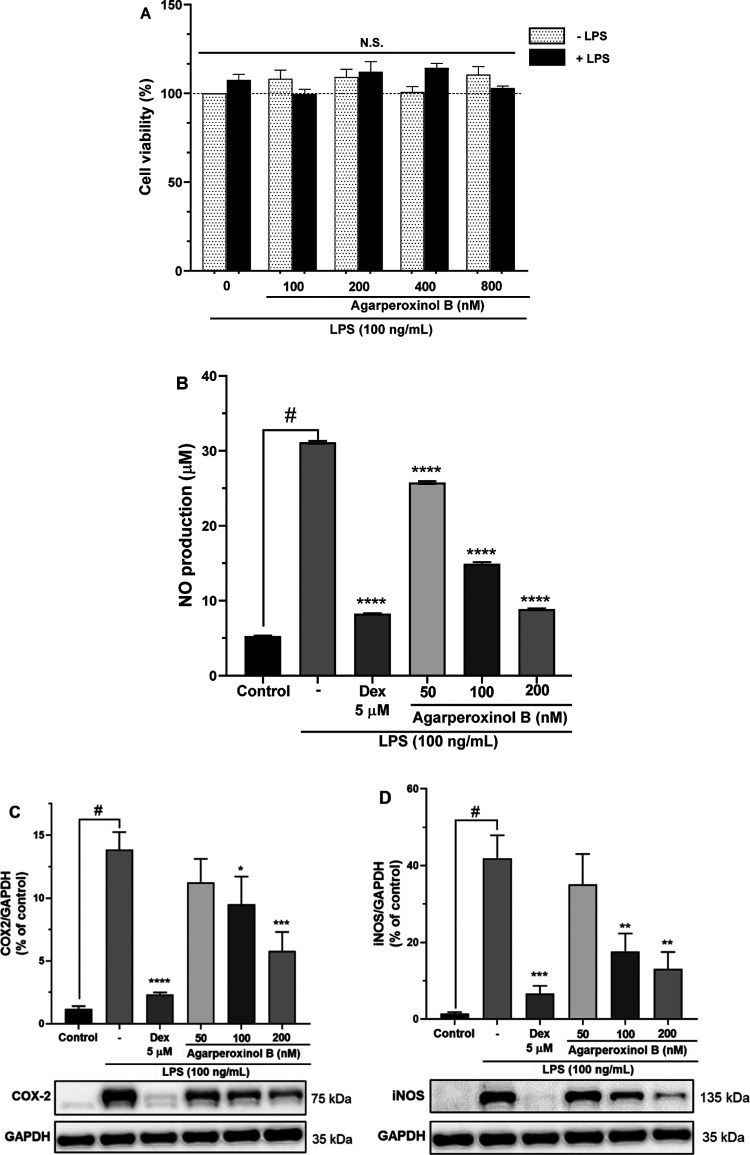
Figure 4.
(A) Cell viability of compound 2 stained by EZ-Cytox for 30 min with absorbance determined at 450 nm; results are the percentage of the control group (n = 5, N.S. not significant). (B) Effect of compound 2 on LPS-induced NO production in microglial BV2 cells (n = 3). The inhibition of (C) COX-2 and (D) iNOS protein expressed by agarperoxinol B on LPS-activated microglial cells. Protein levels were determined using western blot analysis. The relative intensity of iNOS/COX-2 to GAPDH bands was calculated by densitometry (n = 5). The data are presented as mean ± SEM #p < 0.0001 was compared with a sample of the control group. *p < 0.05, **p < 0.01, ***p < 0.001, and ****p < 0.0001 were compared with the LPS group.

