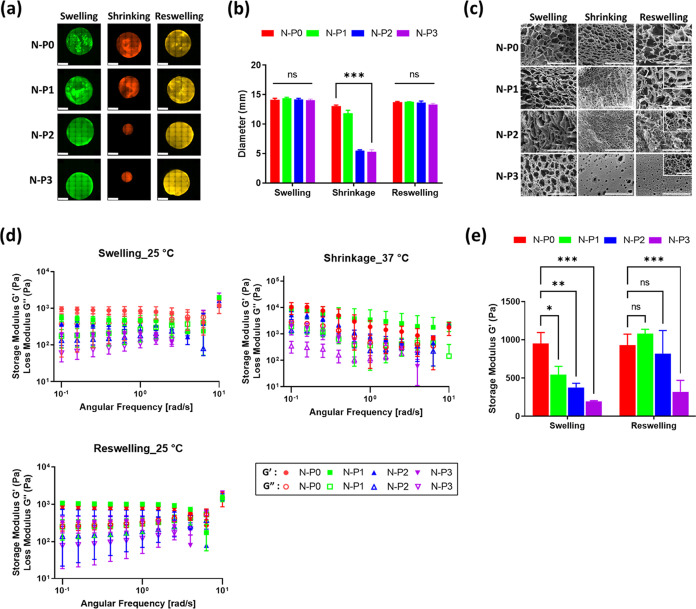
Figure 3.
Evaluation of N–P hydrogel: (a) swelling ratio – representative fluorescence image (scale bar = 5 mm), (b) diameter measurement of N–P hydrogels (n = 3, ***p < 0.001), (c) SEM image (400× and 2.0k×, large scale bar = 100 μm and small scale bar = 20 μm), (d) storage and loss modulus (G′ and G″) of N–P hydrogels after swelling, shrinking, and reswelling, and (e) storage modulus comparison after swelling and reswelling (n = 3, *p < 0.05; **p < 0.01; ***p < 0.001).

