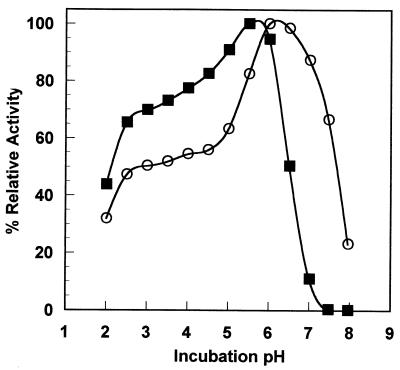
FIG. 4.
Phytase pH-activity profile; comparison of relative enzyme activity at various incubation pHs. A relative activity of 100% corresponds to 1 and 1.21 μmol of inorganic phosphate released per min for A. niger and T. lanuginosus phytases, respectively. Solid square, A. niger phytase; open circles, T. lanuginosus phytase.

