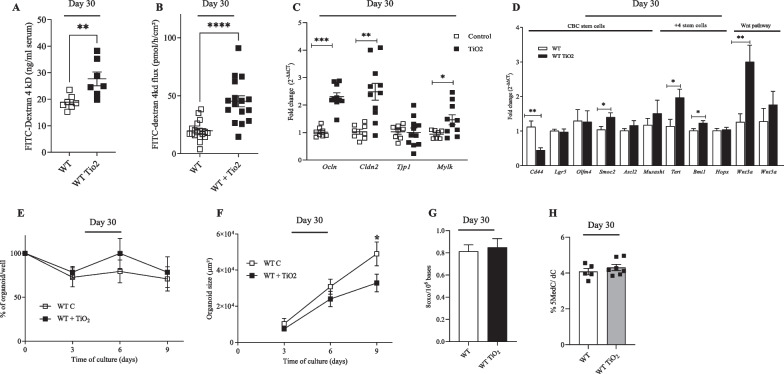
Fig. 3.
Impact of perinatal exposure to foodborne TiO2 on colonic epithelium at day 30. A–D Wild type female mice have been exposed to TiO2 (9 mg/Kg of BW/Day) during the perinatal period including gestational and lactating periods. Then at days 30 after birth (weaning), pups have been sacrificed and several parameters including permeability (A and B), mRNA expression (C and D), abilities of intestinal stem cells to survive (E) and proliferate (F), oxidative stress (G) and DNA methylation (H) were assessed. A In vivo permeability was determined by measuring the level of plasmatic FITC-dextran 4 kDa, 3 h following oral administration. B Colonic permeability was monitored by measuring the flux of FITC-dextran 4 kDa across colonic biopsies mounted in Ussing chamber for 1 h. C mRNA expression of Occludin (Ocl), Claudin 2 (Cldn 2) Tight junction protein 1 (Tpj1) and myosin light chain kinase (Mlck) was studied at days 30 and 50 after birth. D Colonic mRNA expression of CD44, Leucine-rich repeat-containing G-protein coupled receptor 5 (Lgr5), Olfactome-din 4 (Olfm4), SPARC-related modular calcium-binding protein 2 (Smoc2), Achaete-scute complex homolog 2 (Ascl2), Musashi RNA-binding protein 1 (Musashi), Telomerase reverse transcriptase (Tert) and B lymphoma Mo-MLV insertion region 1 homolog (Bmi1), homeodomain-only protein homeobox (Hopx), canonical (Wnt3a) and non-canonical (Wnt5a). E The organoid survival has been monitored by measuring the percentage of viable organoids according to the time culture. F The organoid growth has been studied by measuring the organoid surface according to the time culture. G Oxidative stress has been monitored into the epithelial cells from the colonic based crypt of mice perinatally exposed or not to TiO2. H The quantity of cytosine methylated of DNA from the epithelial cells from the colonic based crypt of mice perinatally exposed or not to TiO2. Data are expressed as mean ± SEM and were analysed by Student’s t-test. *p < 0.05; **p < 0.01; ***p < 0.001 and ****p < 0.0001 vs control group. At least n = 8 per group

