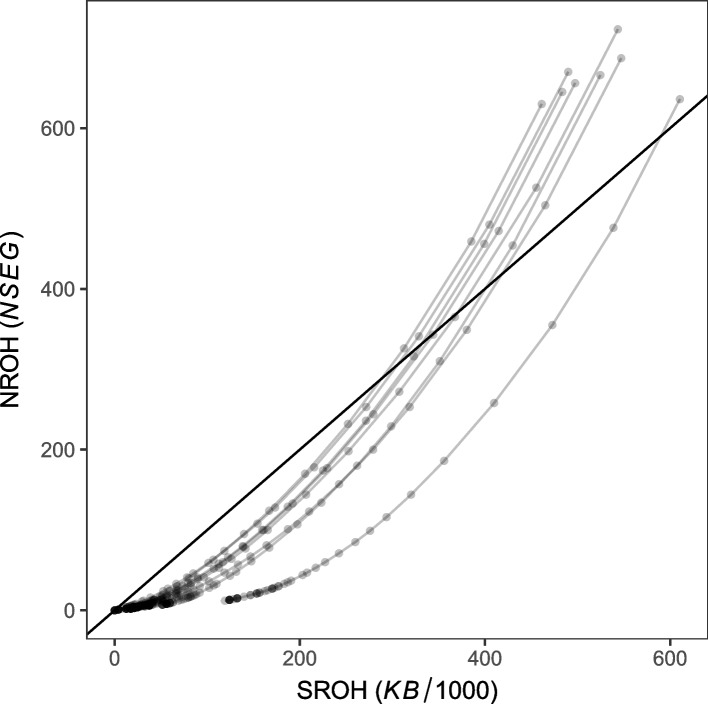
Fig. 2.
Plots for each sample of the number of runs of homozygosity NROH (NSEQ) against the total length of runs SROH (KB/1000) shown for variable minimum ROH lengths Mb (transparent gray points, to show overplotting as darker points). The eight gray lines connecting the points show the nonlinear trajectories travelled by each sample from above the diagonal (black line) for the smallest minimum ROH lengths, crossing below the diagonal for increasing minimum lengths, and finally approaching towards the diagonal for the longest minimum ROH lengths

