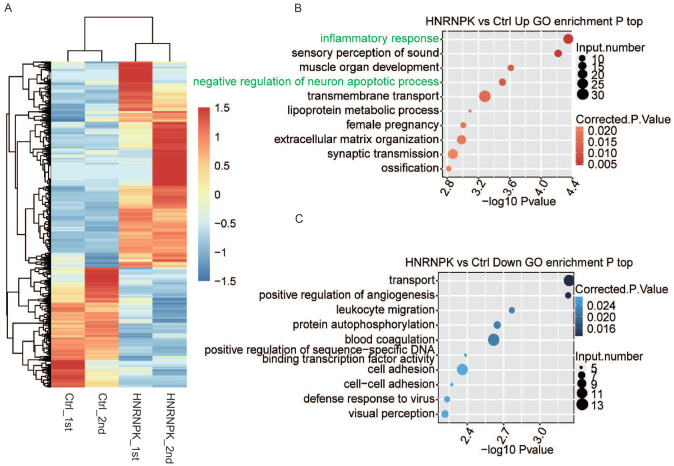
Figure 2.
Changes of gene expression analysis responding to hnRNP K-OE. (A) Heat map of all 2405 DEGs identified in this study. FPKM values are log2-transformed and then median-centered by each gene. (B-C) The top 10 GO biological process terms of genes upregulated (B) and downregulated (C) by hnRNP K-OE. (A color version of this figure is available in the online journal.)

