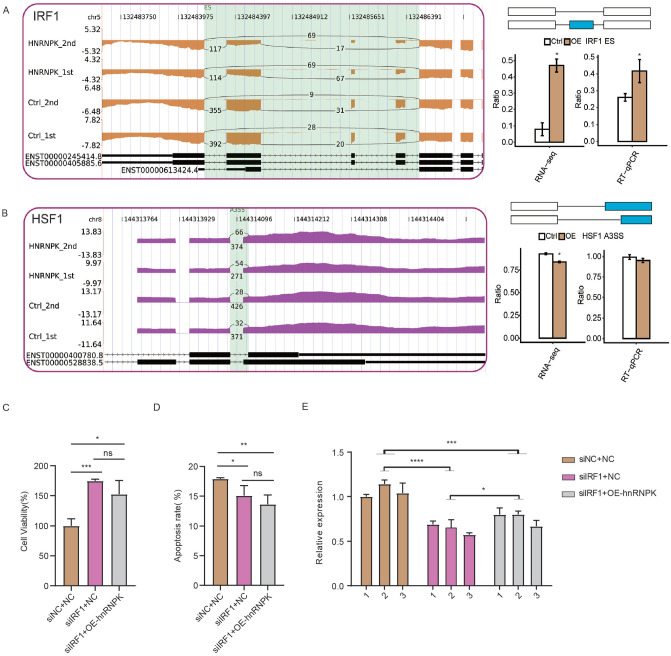
Figure 4.
Validation of hnRNP K-IRF1-CCL5 axis in HeLa cells. IGV-sashimi plots (left panel) and RT-qPCR validation (right panel) showed ASEs and the changed ratio of transcription factors, including (A) IRF1 and (B) HSF1. The schematic diagrams present the structures of AS (right panel, top) and Model (right panel, middle). Boxes denote the exon sequences. The horizontal line denotes the intron sequences. (C) Bar plot showing the cell proliferation rate in three groups. (D) Bar plot showing the cell apoptosis rate in three groups. (E) Bar plot showing the expression level of CCL5. *P < 0.05; **P < 0.01; ***P < 0.001; ****P < 0.0001; Student’s t-test for A-D; two-way ANOVA test for E. (A color version of this figure is available in the online journal.)

