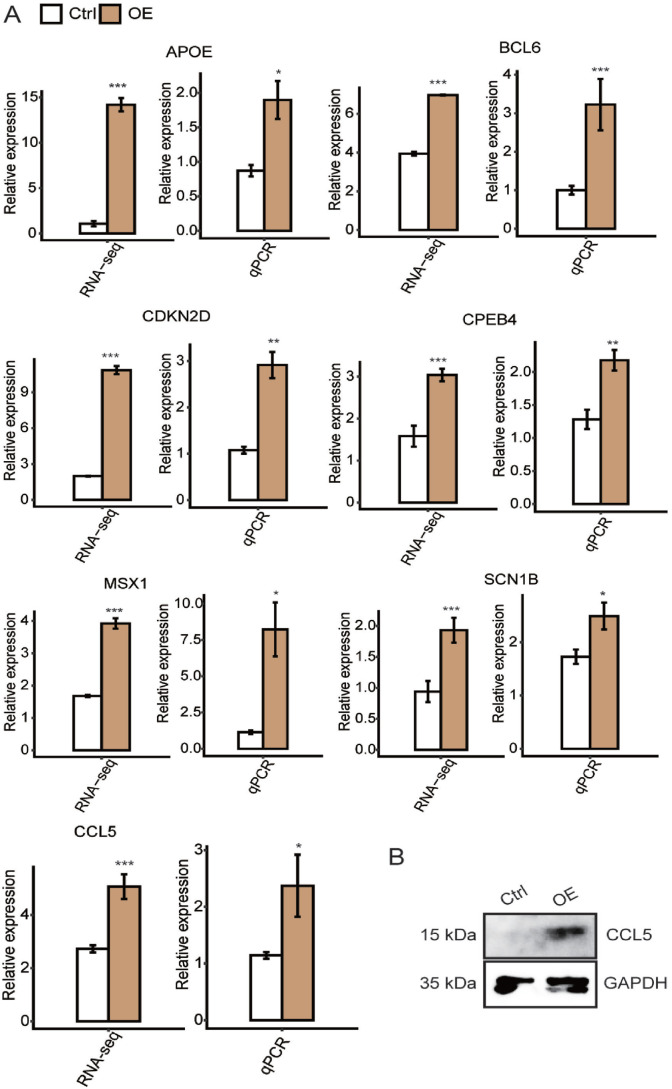
Figure 5.
Validation of hnRNP K–regulated genes by qPCR and Western blot. (A) Bar plot showing the expression levels of seven genes with hnRNP K-OE and control vector in HeLa cells. (B) Validating the effect of hnRNP K–regulated gene CCL5 by conducting Western blot experiment in HeLa cells. (A color version of this figure is available in the online journal.)

