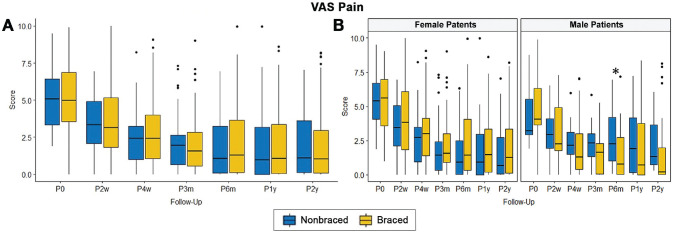
Figure 2.
Comparison of VAS pain scores (A) overall and (B) stratified by patient sex between the nonbraced and braced groups at each follow-up point. *Statistically significant difference between groups (P < .05). The middle horizontal line of the box indicates the median, the top and bottom of the box indicate the upper and lower quartiles, the upper and lower error bars indicate the maximum and minimum values, and the dots indicate statistical outliers. m, month; p, postoperative; VAS, visual analog scale; w, week; y, year.

