. 2023 Nov 23;12:RP91645. doi: 10.7554/eLife.91645

Figure 1. Antibody characterization platform.

(A) The funders of the targets analyzed in this study and the number of targets proposed by each are indicated. (B) Bioinformatic analyses of nominated proteins using Uniprot to determine their molecular mass, unique Uniprot ID and published/expected subcellular distribution. In parallel, analyses of the Cancer Dependency Map (‘DepMap’) portal provided RNA sequencing data for the designated target, which guided our selection of cell lines with adequate expression for the generation of custom KO cell lines. A subset of cell lines amenable for genome engineering were prioritized. (C) Receive relevant KO cell lines or generate custom KO lines and (D) receive antibodies from manufacturing partners. All contributed antibodies were tested in parallel by (E) WB using WT and KO cell lysates ran side-by-side, (F) IP followed by WB using a KO-validated antibody identified in (E) and by (G) IF using a mosaic strategy to avoid imaging and analysis biases. (H) Antibody characterization data for all tested antibodies were presented in a form of a protein target report. All reports were shared with participating companies for their review. (I) Reviewed reports were published on ZENODO, an open access repository. ALS-RAP=amyotrophic lateral sclerosis-reproducible antibody platform, AD = Alzheimer’s disease, MJFF = Michael J. Fox Foundation. KO = knockout cell line.

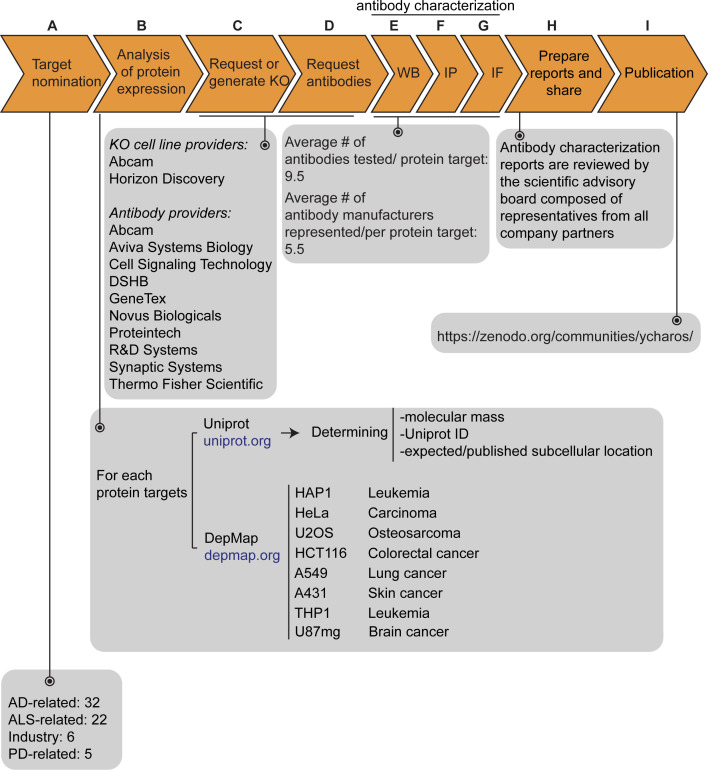
Figure 1—source data 1. Description of the 65 nominated target proteins.
List of all nominated proteins for which an antibody characterization report was generated. The list includes the corresponding protein name, gene name, Uniprot ID, expected subcellular distribution, number of articles referring to the protein itself, the total number of antibodies tested, the number of renewable antibodies tested, the number of companies that have provided antibodies, the cell line background used to generate a KO line, the RNA level – units are log2(TPM +1) and the DOI referring to the antibody characterization report uploaded on ZENODO or to another publication platform.

Figure 1.

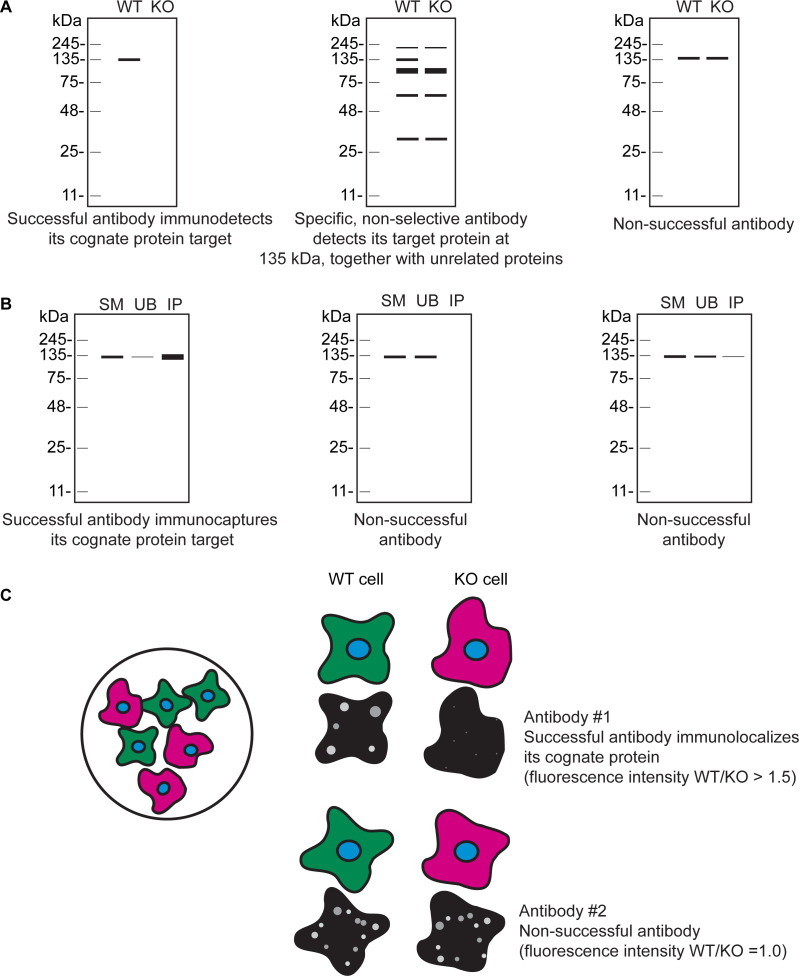
Figure 1—figure supplement 1. Schematic representations of antibody performance.

Figure 1—figure supplement 1.

(A) Schematic representations of a successful antibody (left schematic), specific, non-selective antibody (middle schematic), and a non-successful antibody (right schematic) for WB. (B) Schematic representations of a successful antibody (left schematic) and non-successful antibodies (middle and right schematics) for IP. (C) Schematic representation of the mosaic strategy used (left schematic). WT cells are labelled with a fluorescent cell dye (green), and KO cells are labelled with a different fluorescent cell dye (magenta) plated together as a mosaic. Schematic representations of a successful antibody (antibody #1) and a non-successful antibody (antibody #2) for IF are shown.