. 2023 Nov 23;12:RP91645. doi: 10.7554/eLife.91645

Figure 3. Analysis of antibody performance by antibody types.

The percentage of successful antibodies based on their clonality is shown using a bar graph, for each indicated application. The number of antibodies represented in each category is indicated above the corresponding bar.

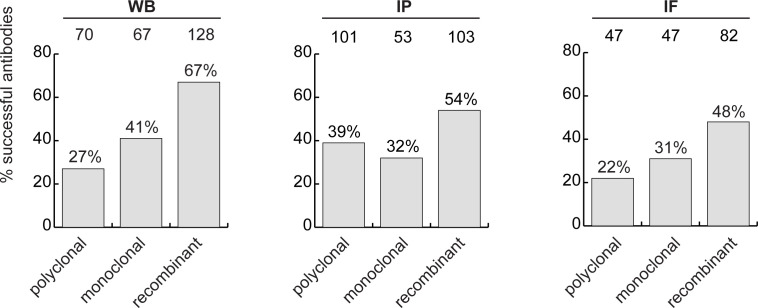
Figure 3.

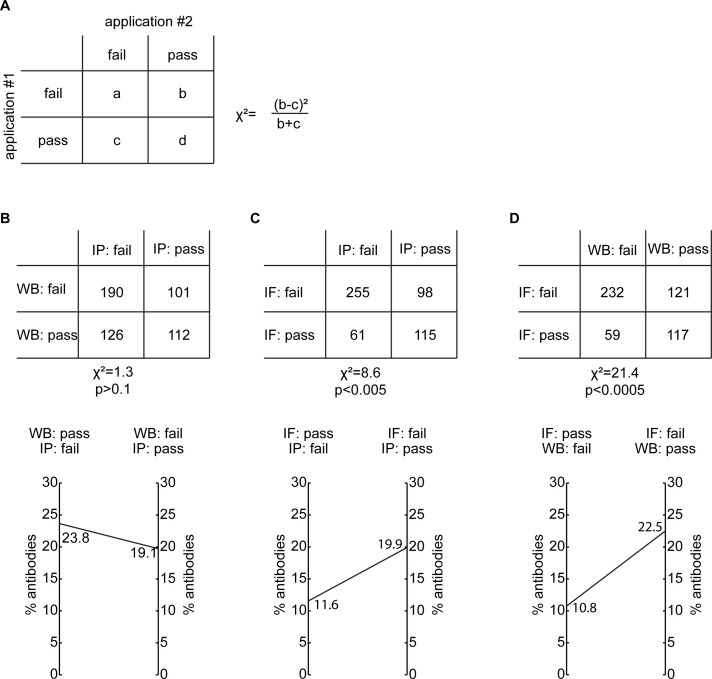
Figure 3—figure supplement 1. Correlation of antibody performance between applications.

Figure 3—figure supplement 1.

(A) Representation of a 2x2 contingency table used to apply the McNemar Test as well as the equation of the chi-square (Χ2) statistic used. Analysis of antibody performance correlation represented as a contingency table and as a double y-axis graph between (B) WB and IP, (C) IF and IP and (D) IF and WB. n/s=non-significant.