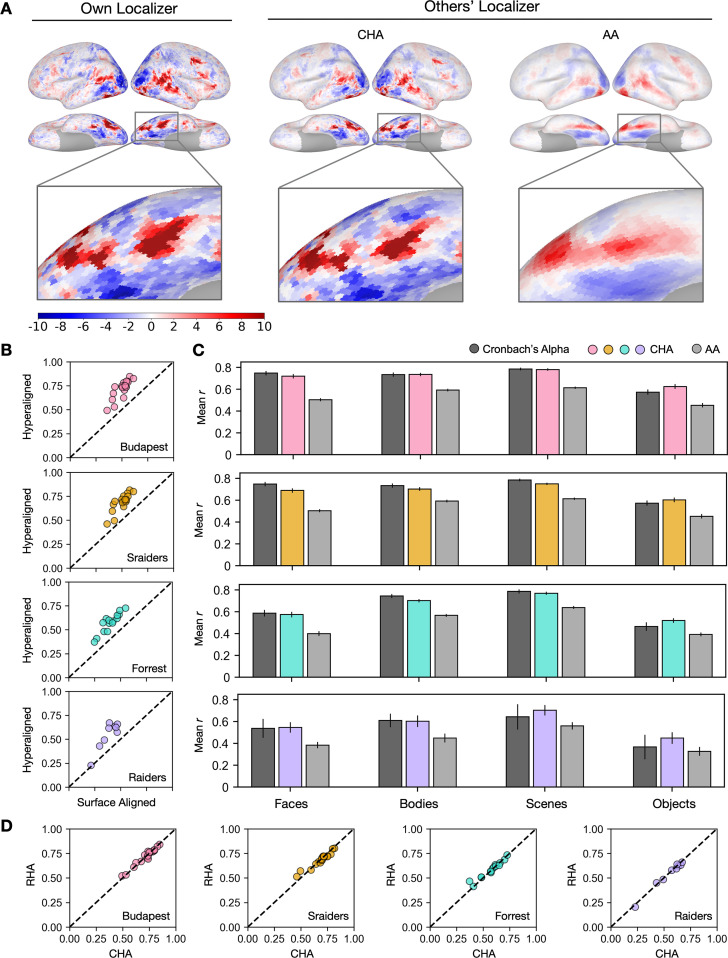
Figure 1. Predicting individual category-selective topographies using connectivity hyperalignment (CHA).
(A) Face-selective topographies (faces-vs-all) and zoomed-in views of an example participant estimated from this participant’s own localizer (Own Localizer), and other participants’ localizers using CHA, and surface anatomical alignment (AA). (B) Scatter plots display the Pearson correlation coefficients between estimated face-selective topographies based on own localizer data and other participants’ localizer data in individual participants in four different datasets. The y-axis corresponds to correlations between each target participant’s own localizer-based face-selective topographies and face-selective topographies estimated from other participants using CHA. The x-axis corresponds to correlations between each target participant’s own localizer-based face-selective topographies and face-selective topographies estimated from other participants with surface-based anatomical alignment. (C) Bar plots show the mean correlations across participants in four datasets (Budapest & Sraiders: n = 20; Forrest: n = 15; Raiders: n = 9. Same sample sizes in other figures for each dataset unless noted.) and for all four category-selective topographies. Black bars stand for the mean Cronbach’s alphas across participants. Error bars indicate ±1 standard error of the mean. Category topographies were defined based on contrasts between the target category and all other categories. (D) Scatter plots of Pearson correlation coefficients using CHA and response hyperalignment (RHA) for individual participants within four different datasets for the face-selective topography. Values on the y-axis stand for correlations between each target participant’s own localizer-based topographies and topographies estimated from other participants in the same dataset using RHA. Values on the x-axis stand for correlations between each target participant’s own localizer-based topographies and topographies estimated from other participants in the same dataset using CHA.


