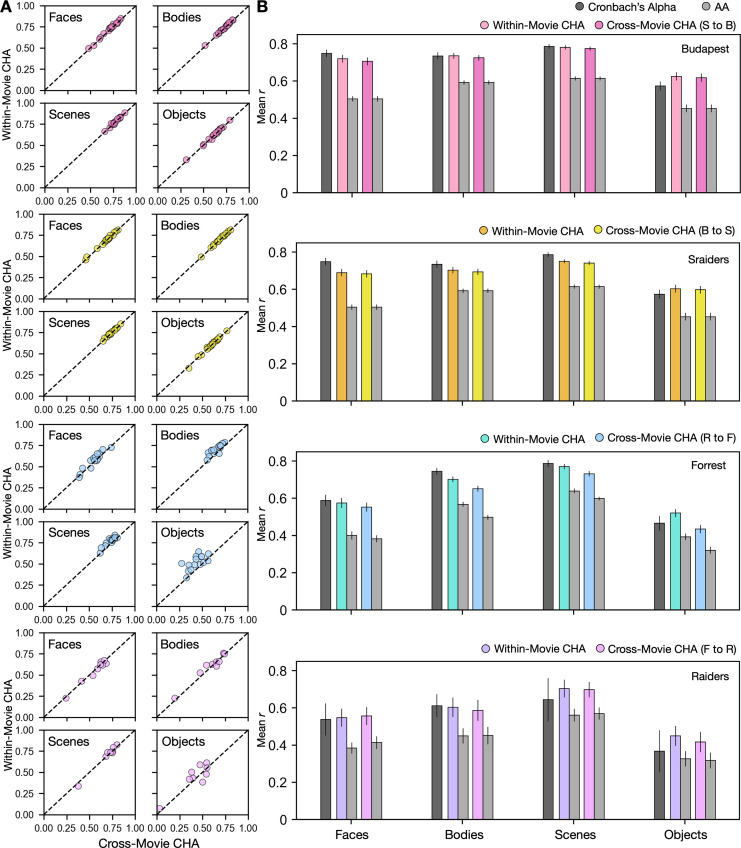
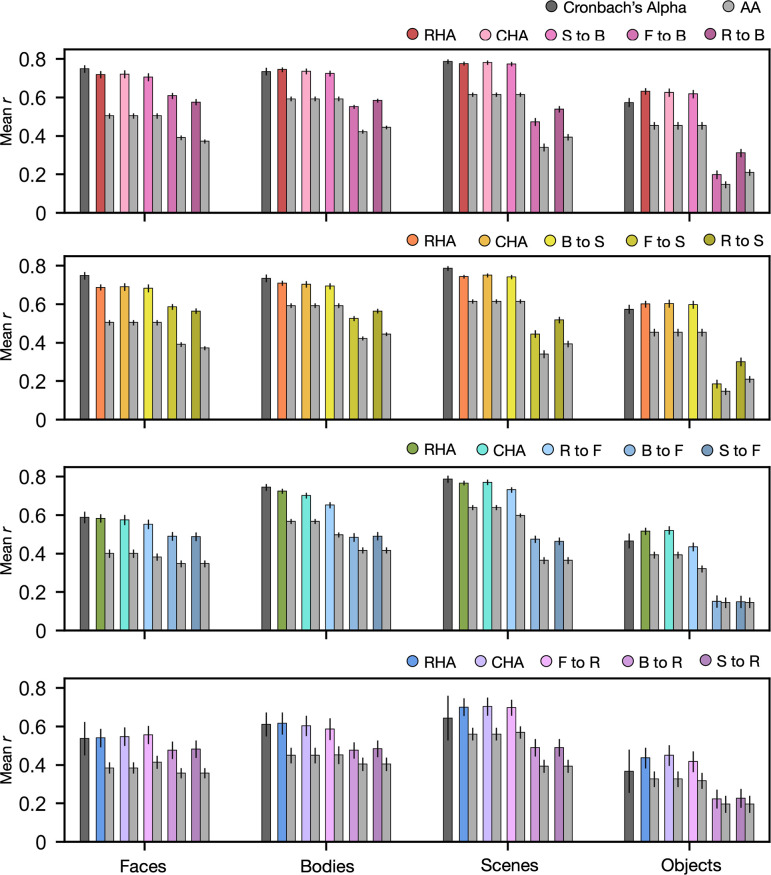
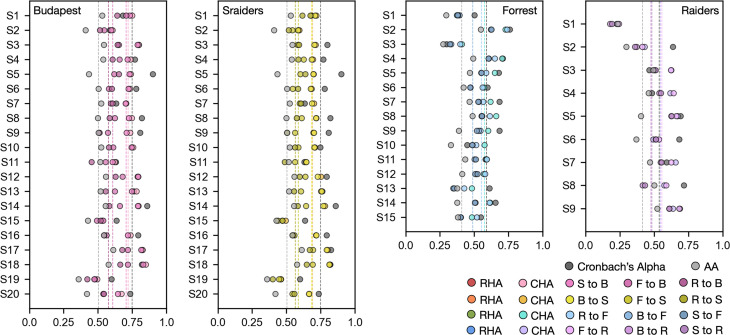
Figure 2. Predicting category-selective topographies using connectivity profiles across movies.
(A) Scatter plots of Pearson correlation coefficients for individual participants in four different datasets and for four categories. Values on the y-axis stand for correlations between each target participant’s own localizer-based topographies and topographies estimated from other participants in the same movie using connectivity hyperalignment (CHA). Values on the x-axis stand for correlations between each target participant’s own localizer-based topographies and topographies estimated from participants in another dataset based on cross-movie CHA. (B) Bar plots display the mean Pearson correlation coefficients (r) and Cronbach’s alphas across participants in all four datasets for all four categories. Error bars stand for ±1 standard error of the mean. S to B: Sraiders to Budapest, B to S: Budapest to Sraiders, R to F: Raiders to Forrest, F to R: Forrest to Raiders.


