
Fig. 2.
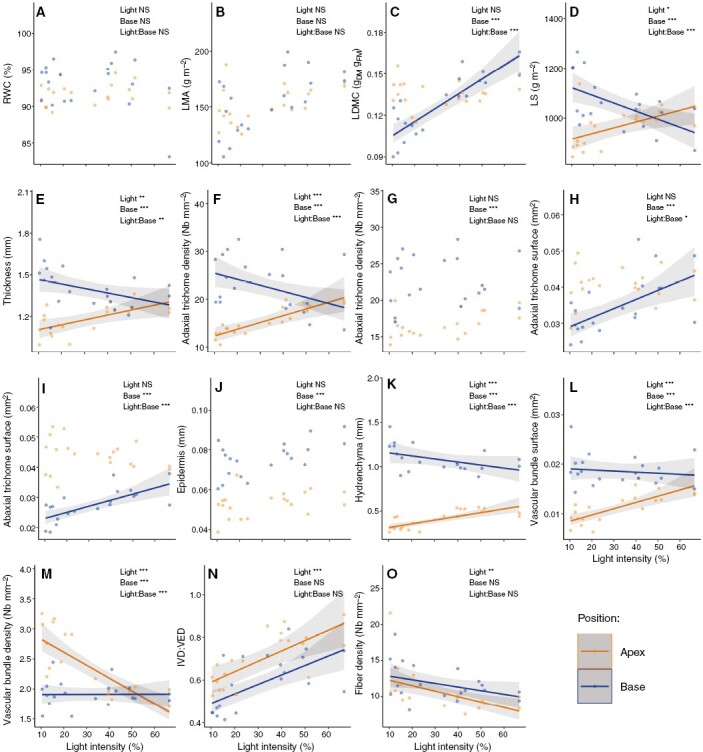
Effect of light intensity gradient on apex and basal leaf portion characteristics. Effects of light intensity (%) according to the leaf portion (apex and base) on (A) relative water content (RWC), (B) leaf mass area (LMA), (C) leaf dry mass content (LDMC), (D) leaf succulence (LS), (E) leaf thickness, (F) adaxial trichome density, (G) abaxial trichome density, (H) adaxial trichome surface, (I) abaxial trichome surface, (J) epidermis and cuticle thickness, (K) hydrenchyma thickness, (L) vascular bundle surface, (M) vascular bundle density, (N) interveinal distance/vein–epidermis distance ratio (IVD/VED) and (O) fibre density. Dots are observations, orange and blue colours correspond to the apex and basal portion of the leaf, respectively. Solid lines represent the regression line of significant (α < 0.05) linear models and shaded in grey is the 0.95 confidence interval. At the top right corner of each plot is given the significance of the effects of light intensity (Light), basal position compared to apex (Base) and their interactions (Light:Base). *P < 0.05; **P < 0.01; ***P < 0.001; NS, not significant.