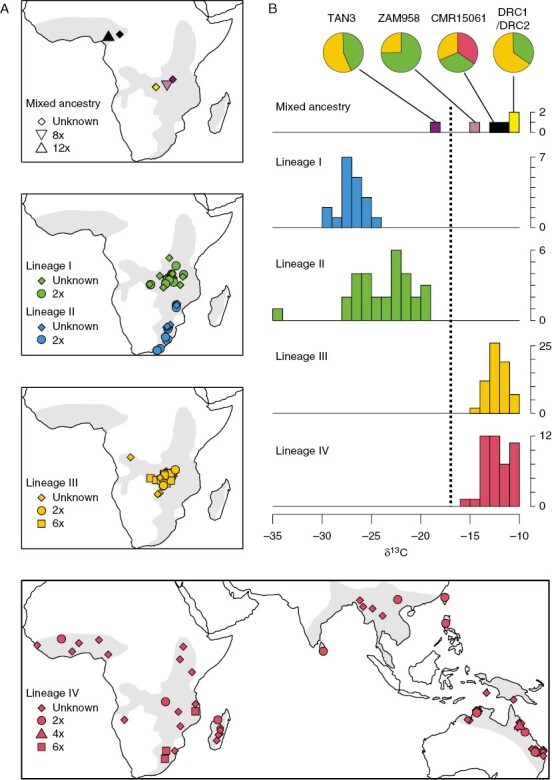
Fig. 3.

Geographical distribution and photosynthetic diversity of Alloteropsis semialata. (A) For each of the four main lineages of A. semialata (lineage I in blue, lineage II in green, lineage III in orange and lineage IV in red), the distribution of known samples is shown, with shapes indicating their ploidy level (for data, see Supplementary Data Table S2). Individuals of mixed ancestry unassigned to these lineages are shown separately. The grey area on each map shows the putative range of the species, based on known individuals plus reported samples on GBIF (https://www.gbif.org/). (B) The distribution of carbon isotope ratios (δ13C) is shown with histograms for each group. In the case of individuals with mixed ancestries, the relative parental contributions of the four lineages are shown with pie charts.
