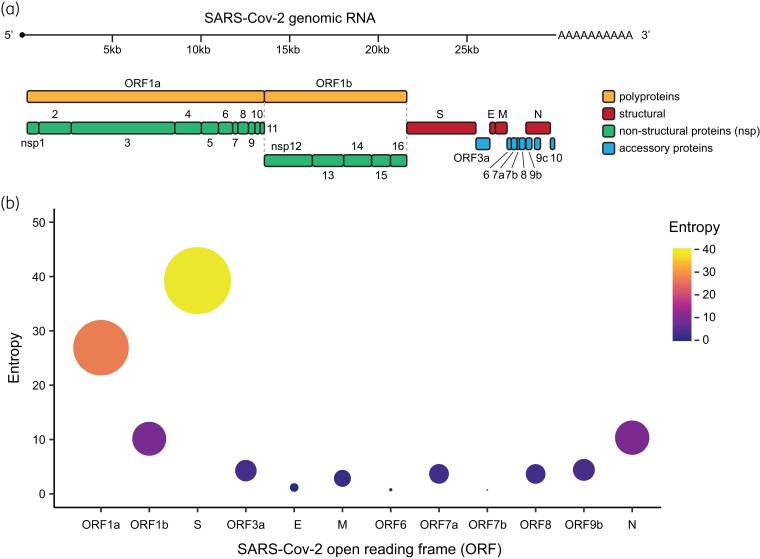
Figure 2.
Different SARS-CoV-2 ORFs have accumulated different amounts of variability. (a) Schematic of the SARS-CoV-2 genome and encoded proteins, separated broadly in the figure by function. (b) Entropy (a measure of genetic variability) in each SARS-CoV-2 ORF. Dot size and colour reflect the degree of entropy accumulated in the viral population since its emergence. This figure appears in colour in the online version of JAC and in black and white in the print version of JAC.

