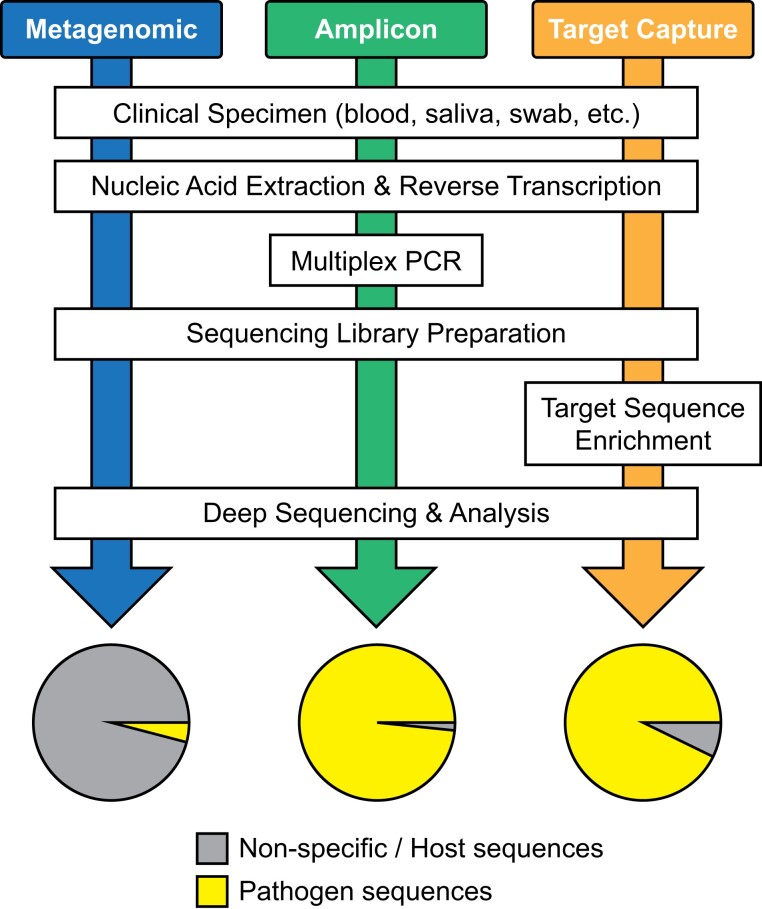
Figure 3.
Workflow diagram comparing metagenomic, amplicon-based and target capture strategies for pathogen genomics. The pie charts at the end depict the theoretical yield of pathogen sequence versus host or non-specific background. This figure appears in colour in the online version of JAC and in black and white in the print version of JAC.

