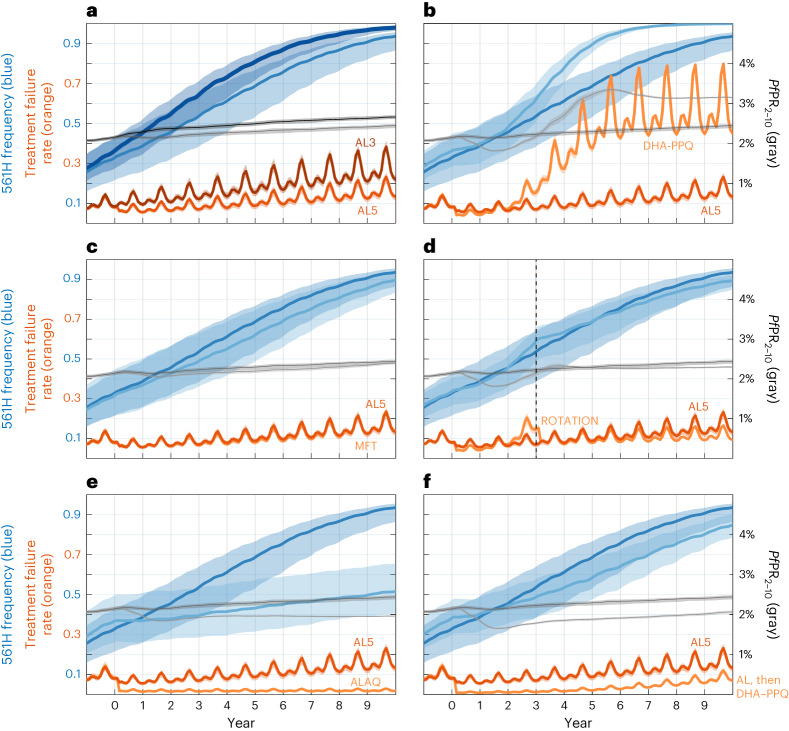
Fig. 2. Projected 561H allele frequencies and treatment failure percentages under potential intervention scenarios.
The right-hand axis shows 12-month-smoothed malaria prevalence (PfPR2–10). All strategies are evaluated over 10 years with year 0 corresponding to the year the strategy was first implemented. Shaded bands show IQR. a, Comparison between the status quo treatment of 3 d of AL therapy (AL3, darker lines) and 5 d of AL therapy (AL5). b, Comparison between AL5 and switching to DHA–PPQ (lighter lines) as first-line therapy. Note here that under DHA–PPQ prevalence drops early (to <2%) and later rises to nearly 3.5%. This occurs because piperaquine resistance evolves quickly and reaches >0.50 genotype frequencies after 3 years, resulting in high prevalence and high levels of treatment failure. c, Comparison between AL5 (darker colors) and an MFT policy using ASAQ (75% of treatments) and DHA–PPQ (25%). d, Comparison between AL5 (darker colors) and a rotation strategy where DHA–PPQ is used for 3 years and then replaced with an MFT policy using AL5 (50%) and ASAQ (50%). e, Comparison between AL5 (darker colors) and the triple therapy ALAQ. f, Comparison between AL5 (darker colors) and sequential courses of AL on days 0, 1 and 2 and DHA–PPQ on days 7, 8 and 9.

