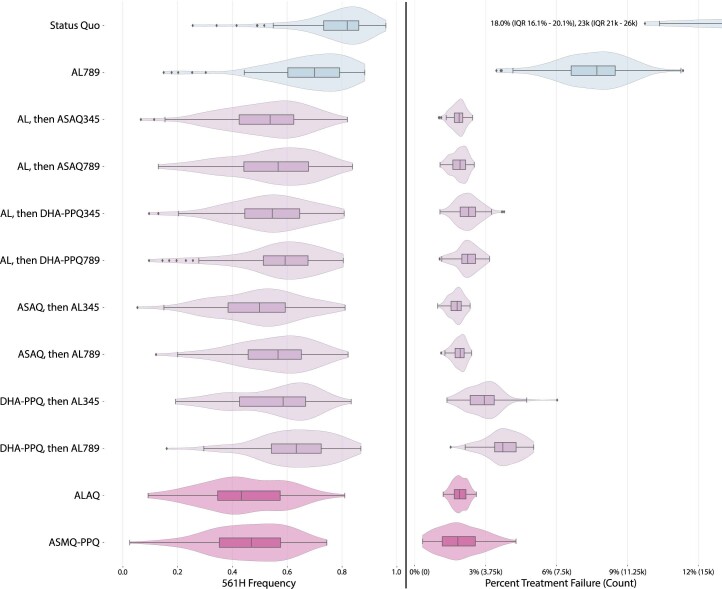
Extended Data Fig. 4. Projected 561H frequency and population-level treatment failure percentage in 2028 under sequential courses of ACT and triple ACTs.
Box plots (n = 100 model replicates per policy, median line with interquartile range (IQR)) and violin plots of 561H frequency and percent treatment failure at a population level. Whiskers show 1.5 times IQR while all other outliers (outside 1.5 × IQR) are plotted individually as diamonds. The allele frequency is taken in December 2028 and treatment failure percentages and counts are averages over all twelve months of 2028.

