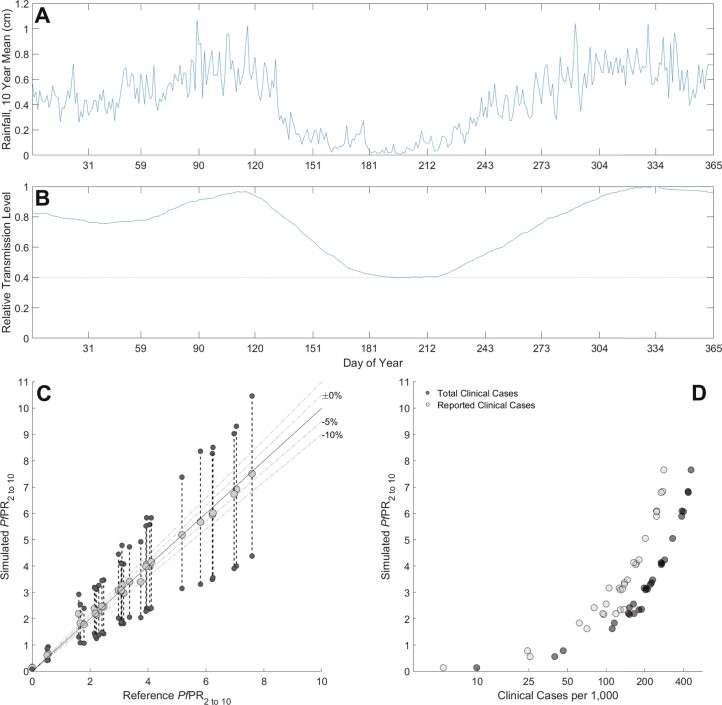
Extended Data Fig. 5. Calibration of incidence and seasonality.
(a) Mean daily rainfall over the period 2009–2019 reported from ERA5 global climate and weather projections64. (b) Model’s relative transmission parameter (β) based on 54-day smoothing and normalization of rainfall data, note the lower bound of 0.4 during the low transmission season ensures some transmission is always present. (c) Comparison of simulated PfPR2-10 to reference PfPR2-10 from the Malaria Atlas Project50, with large gray circles showing the 12-month mean PfPR2-10 and smaller dark gray circles showing peak and trough PfPR2-10 during a single year. (d) Relationship between model PfPR2-10 and model’s malaria case counts (total and reported). Reported cases are total cases multiplied by the drug coverage.

