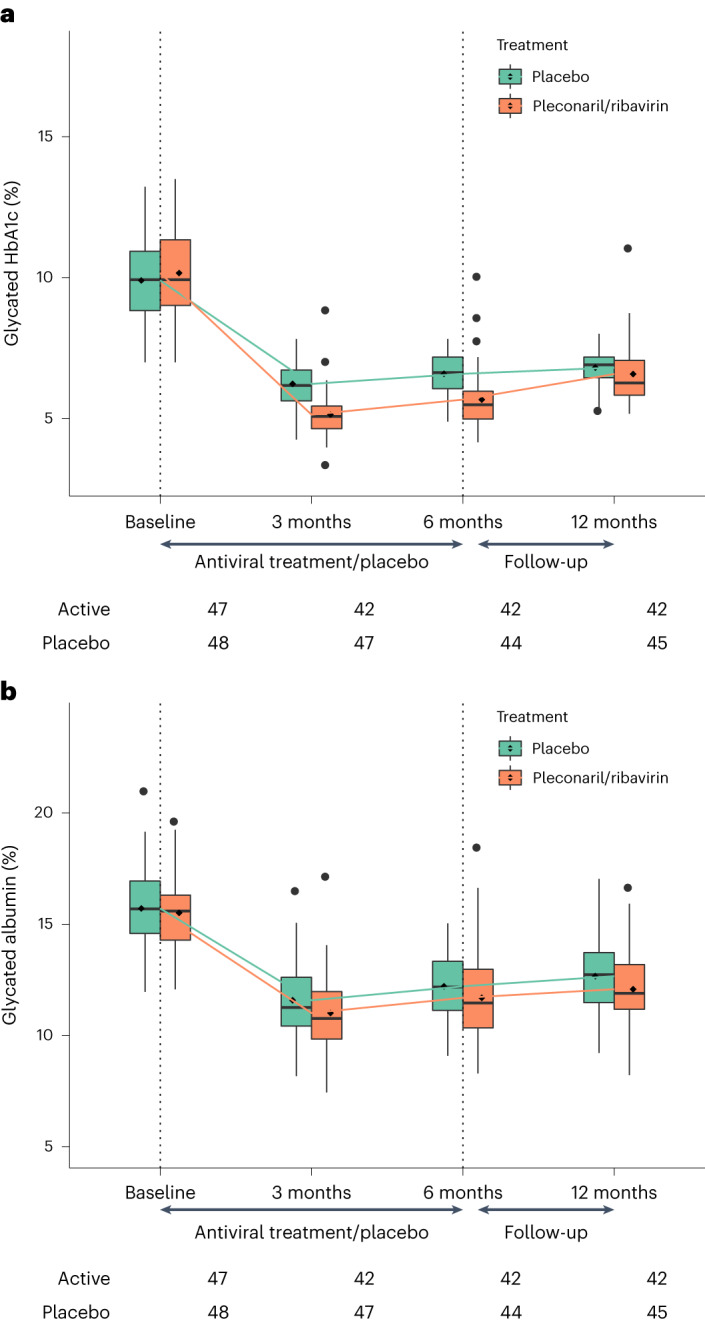
Fig. 3. Metabolic control.

a,b, The box plots show HbA1c (a) and glycated albumin (b), respectively. HbA1c was significantly lower in the pleconaril and ribavirin group compared to the placebo group at 3 and 6 months, but not at 12 months. Glycated albumin was not significantly different between groups at any time point. The numbers beneath the x axis reflect the number of participants in each group with the respective endpoint at each time point. The line inside the box represents the median; the box boundaries represent the 25th and 75th percentiles (the box is the IQR); the whiskers represent the highest or lowest values within 1.5× the IQR; the points outside 1.5× the IQR represent the potential outliers, including the maximum and minimum values.
