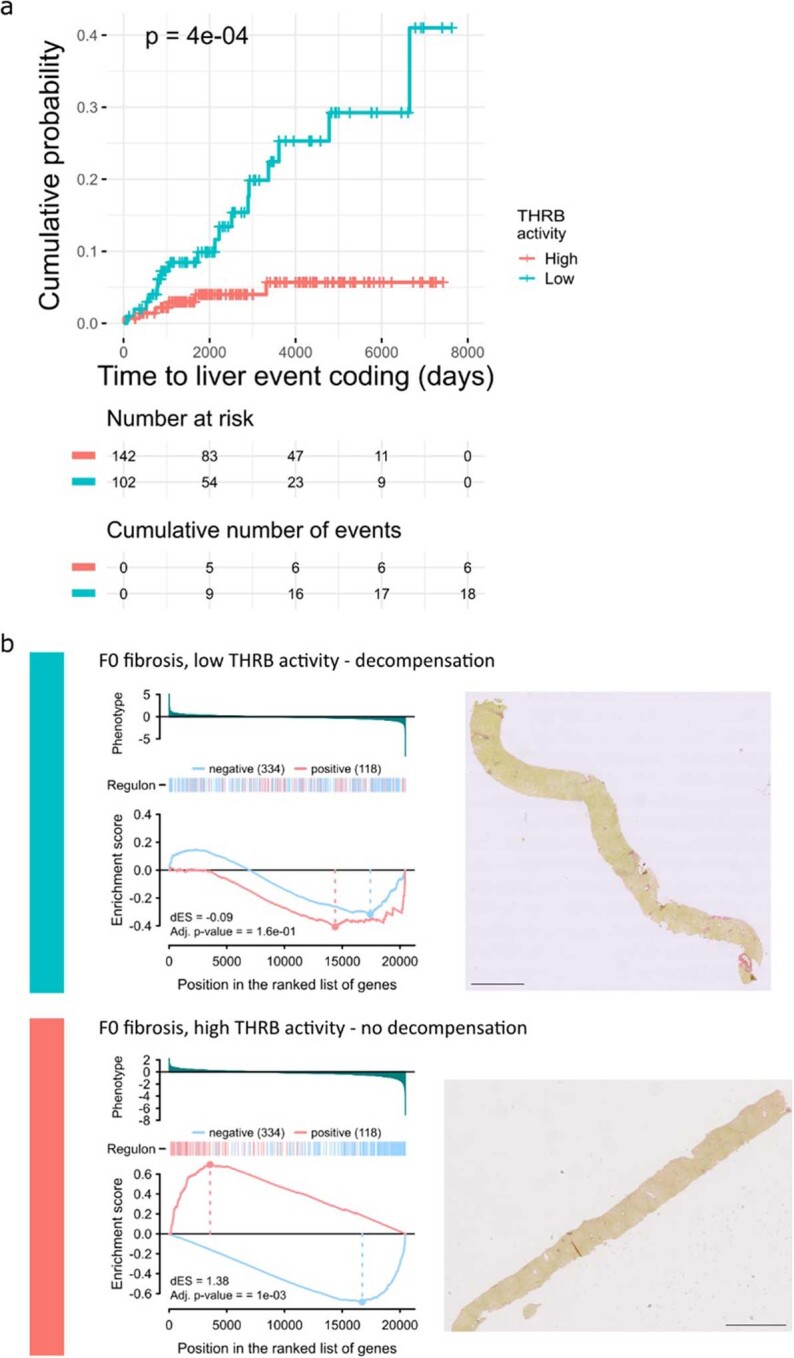
Extended Data Fig. 8. Additional predictive and personalisation value of estimated THRB regulon activity in F0 and F1 stage disease.

a, In histologically identical low-risk fibrosis stages (F0 and F1 biopsy cases), low THRB activity identifies patients at high risk of progression to a hepatic decompensation event; log rank test P-value. b, Example individual 2-tailed gene set enrichment plots of target genes in the THRB regulon (left, 2-tailed gene set enrichment testing with Benjamini and Hochberg (false discovery rate) adjusted P-values) from two patients with identical F0 stage (no scarring) on PSR stained sections (right), where the patient with low THRB differential regulon activity (top, blue) progressed to a hepatic decompensation event 3000 days after biopsy in contrast to a patient with high THRB regulon activity who did not experience a decompensation event during the 4400 days until censoring (bottom, red). Scale bars, 2 mm.
