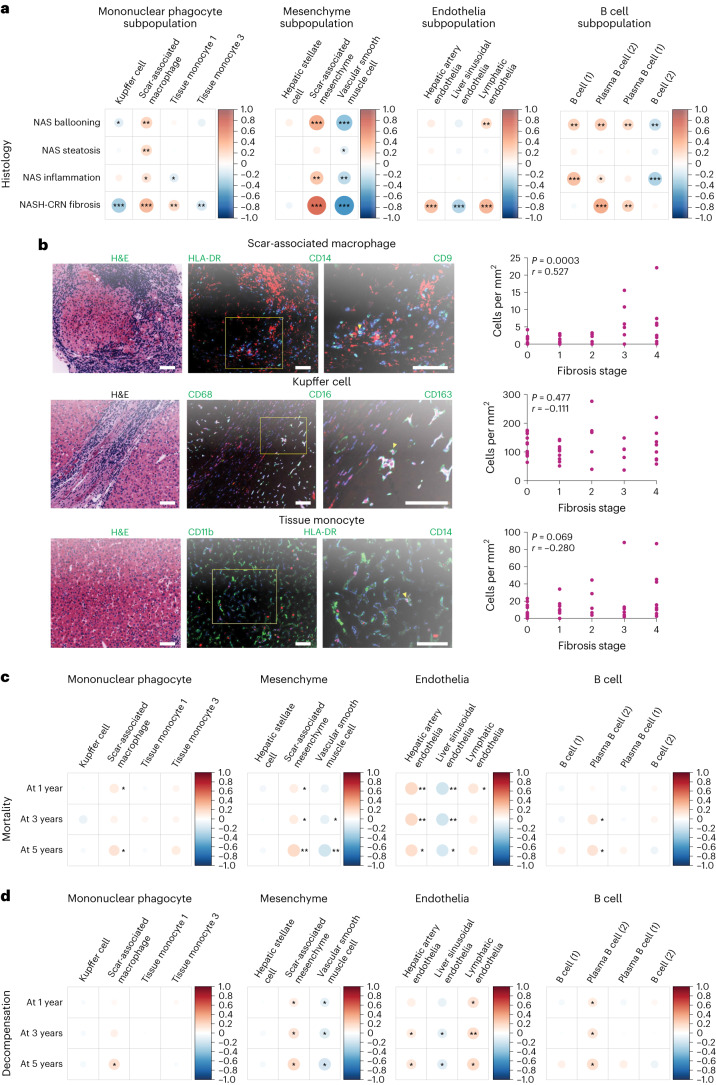
Fig. 3. Hepatic bulk RNA-seq data with clinical annotation.
a, Corrplots of macrophage, mesenchyme, endothelia and B cell subpopulation proportion correlations with NAS components and NASH-CRN fibrosis stage. *P < 0.05, **P < 0.01, ***P < 1 × 10⁻⁶. Color and size of circles indicate the Pearson correlation coefficients. b, Representative H&E-stained sections and multiplex immunofluorescent staining to identify subpopulations of SAMacs, Kupffer cells and tissue monocytes. Selected markers shown. Arrowheads indicate stated cell type. Correlation of number of stated cell type per mm2 tissue with fibrosis stage (n = 43; Spearman’s rho and P value indicated). Scale bars, 100 µm. c,d, Corrplots of macrophage, mesenchyme, endothelia and B cell subpopulation proportion correlations with 1-, 3- and 5-year all-cause mortality (c) and decompensation risk (d). *P < 0.05, **P < 0.01. Color and size of circles indicate the Pearson correlation coefficients.

