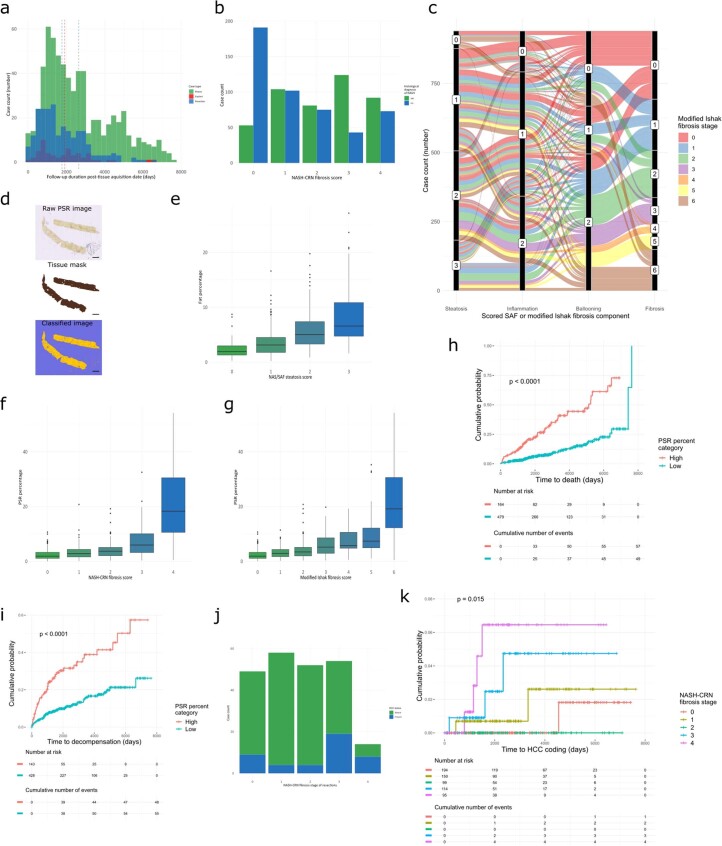
Extended Data Fig. 1. Additional histopathological analyses.
a, Clinical follow-up depth (in days) according to specimen type. b, Clinical assessment of the presence or absence of a histological diagnosis of steatohepatitis versus NASH-CRN stage. c, Alluvial diagram illustrating the relationship between the scored SAF and modified Ishak stage features. d, A representative whole-slide image of a PSR-stained section with the associated tissue mask and applied classifier showing PSR-positive (red) and fat droplets (purple) from the QuPath quantitative pathology pipeline; only pixels present within the tissue mask are used for PSR and fat quantitation. Pixel classification using the same classifier always returns the same values so was only undertaken once. Scale bar, 2 mm. e, The amount of steatosis from image quantification versus NAS steatosis assigned scores from the 922 cases with quantifiable whole-slide images. f, The PSR percentage from image quantification versus assigned NASH-CRN scores from the 922 cases with quantifiable whole-slide images. g, The PSR percentage from image quantification versus assigned modified Ishak scores from the 922 cases with quantifiable whole-slide images. All boxplots show median (centre line), first and third quartiles (lower and upper box limits), 1.5× interquartile range (whiskers). Computationally-derived scar proportion can be used to stratify the risk of all-cause mortality (h) and hepatic decompensation (i); log–rank test P-values < 0.0001. j, Count of presence or absence of hepatocellular carcinoma (HCC) in resection cases versus assigned NASH-CRN stage. k, Kaplan–Meier time-to-event analysis for HCC in patients with biopsies showing early disease (fibrosis stages F0 to F2), bridging fibrosis (stage F3) and cirrhosis (stage F4); log–rank test P-value = 0.015.

