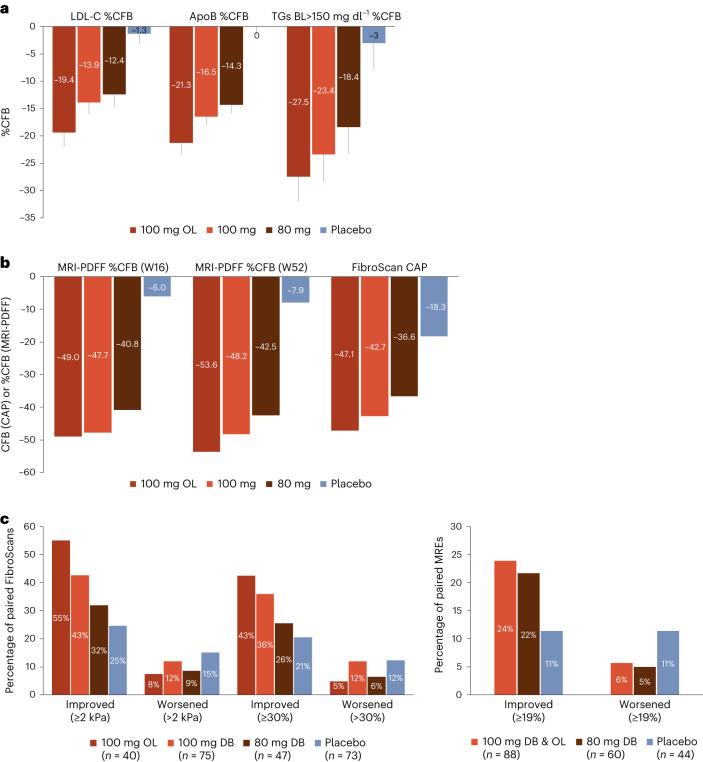
Fig. 2. Resmetirom-mediated changes in atherogenic lipid levels and non-invasive biomarkers.
a, Least squares mean %CFB in LDL-C, apoB and TG at week 24 (100 mg OL n = 169; 100 mg DB n = 314; 80 mg DB n = 320; placebo n = 309). TG reported in subgroup with baseline TG levels >150 mg dl−1 (100 mg OL n = 97; 100 mg DB n = 169; 80 mg DB n = 166; placebo n = 163). Data are presented as mean ± s.e.m. b, Median %CFB in hepatic fat (measured by MRI-PDFF) at weeks 16 and week 52 (100 mg OL n = 152; 100 mg DB n = 268; 80 mg DB n = 258; placebo n = 268) as well as mean CFB in FibroScan CAP at week 52 (100 mg OL n = 147; 100 mg DB n = 270; 80 mg DB n = 260; placebo n = 260). c, Percentage of patients whose VCTE results improved or worsened by either ≥2 kPa or ≥30% from baseline at week 52 (100 mg OL n = 50; 100 mg DB n = 102; 80 mg DB n = 83; placebo n = 107) (left). Percent of patients whose MRE results improved or worsened by ≥19% from baseline (right). mITT population. BL, baseline.

