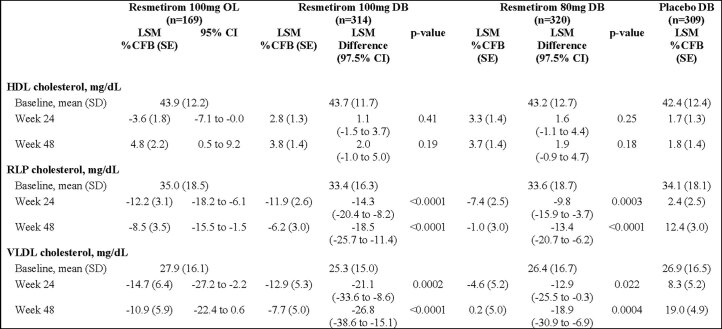
Extended Data Table 3.
Lipids and lipoproteins at baseline and percent change from baselinea
aEnd points reported as percent change from baseline (%CFB). Lipids, lipoprotein particles and lipoproteins are evaluated at Week 24 and Week 48 as LSM %CFB; other analytes as Week 52 LSM CFB. This trial was designed to maintain an overall study-wise type I error rate of α = 0.05 for the key secondary end points only. The error rate was controlled by first splitting the overall two-sided α = 0.05 into 2 partitions via the Bonferroni method, and then the key secondary end points tested in a prespecified hierarchical order. For the primary analysis of key secondary lipid end points, an analysis of covariance (ANCOVA) model was used to analyze each set of 10 imputed datasets. The ANCOVA models for each lipid outcome included percent change from baseline to Week 24 (and all other end point visits) as the dependent variable; treatment and stratification factors (presence of type 2 diabetes and ASCVD) as independent variables; and baseline lipid values as a covariable. The statistical method of estimating the treatment effect and testing for apoB and TG was similar to the LDL-C end point; a similar ANCOVA model was used whereby the baseline value of the dependent variable was included as covariate instead of LDL-C.CFB, change from baseline; CI, confidence interval; DB, double-blind; ELF, enhanced liver fibrosis; HDL, high-density lipoprotein; HDL-C, high-density lipoprotein cholesterol; LDL, low-density lipoprotein; LSM, least squares mean; OL, open-label; RLP, remnant-like particle; SD, standard deviation; SE, standard error VLDL, very low-density lipoprotein.

