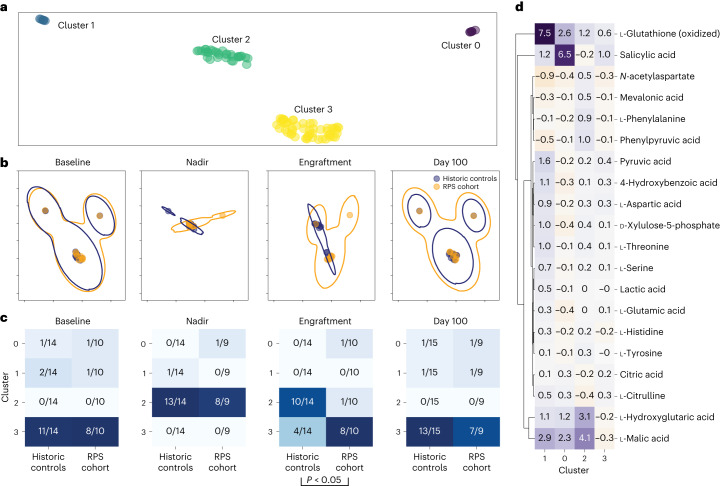
Fig. 4. Plasma metabolites in historic controls versus recipients of RPS.
a, UMAP ordination of median-centered plasma metabolite levels revealed four distinct clusters of metabolites. b, UMAP ordination stratified according to clinical group (historic controls in blue or recipients of RPS in orange), with the largest divergence in overlap at engraftment. c, Contingency tables of plasma metabolite groups stratified according to clinical group (historical controls or recipients of RPS) at four time points with baseline to the far left, followed by nadir, then by engraftment and then by day 100 to the far right. Chi-squared contingency testing P values are reported, with only significant differences between the RPS and historical control cohorts at engraftment. d, Regression revealed a subset of metabolites driving each cluster, with cluster 3 (dominant at baseline) notable for metabolite levels close to the median.

